Montana, often referred to as the “Treasure State,” is the fourth largest state in the United States by land area. This vast expanse, coupled with dramatic variations in elevation and topography, results in a highly diverse and dynamic Montana Usa Climate. Understanding the climate patterns here is crucial for anyone planning a visit, considering relocation, or simply interested in the environmental factors shaping this unique region. From the sprawling plains of the east to the rugged peaks of the west, Montana experiences distinct seasonal changes and is grappling with the impacts of a warming world.
Montana’s climate is heavily influenced by its varied geography. The state is broadly divided into two major climatic zones: the eastern plains, part of the Northern Great Plains, characterized by a semi-arid continental climate with warm summers and cold winters, and the western mountainous region, featuring a more varied climate influenced by elevation, with snowy winters and cooler summers.
Elevations range significantly, from approximately 1,800 feet in the east to over 12,800 feet in the mountains, leading to considerable temperature variations across the state. Average January temperatures in valleys and plains can be below 12°F in the northeast, rising to over 25°F in some south-central and far western areas. Conversely, average July temperatures span from less than 64°F in the western mountains to over 72°F in the southeastern plains (based on 1991–2020 normals).
Understanding Montana Usa Climate Trends
Montana’s climate has undergone significant changes over the past century. Temperatures across the state have risen by nearly 2.5°F since the early 1900s, a rate higher than the average warming observed across the contiguous United States. This trend is particularly evident in the early 21st century, which represents the warmest period on record for Montana. The warming has been observed across all seasons and in most areas of the state.
Figure 1 illustrates these observed and projected temperature changes for Montana compared to the 1901–1960 average. The orange line shows the historical warming trend. The shading indicates projections under different emissions scenarios, clearly showing that historically unprecedented warming is expected throughout this century, with significantly higher increases under a higher emissions pathway. This scientific data highlights the ongoing shift in the Montana Usa Climate.
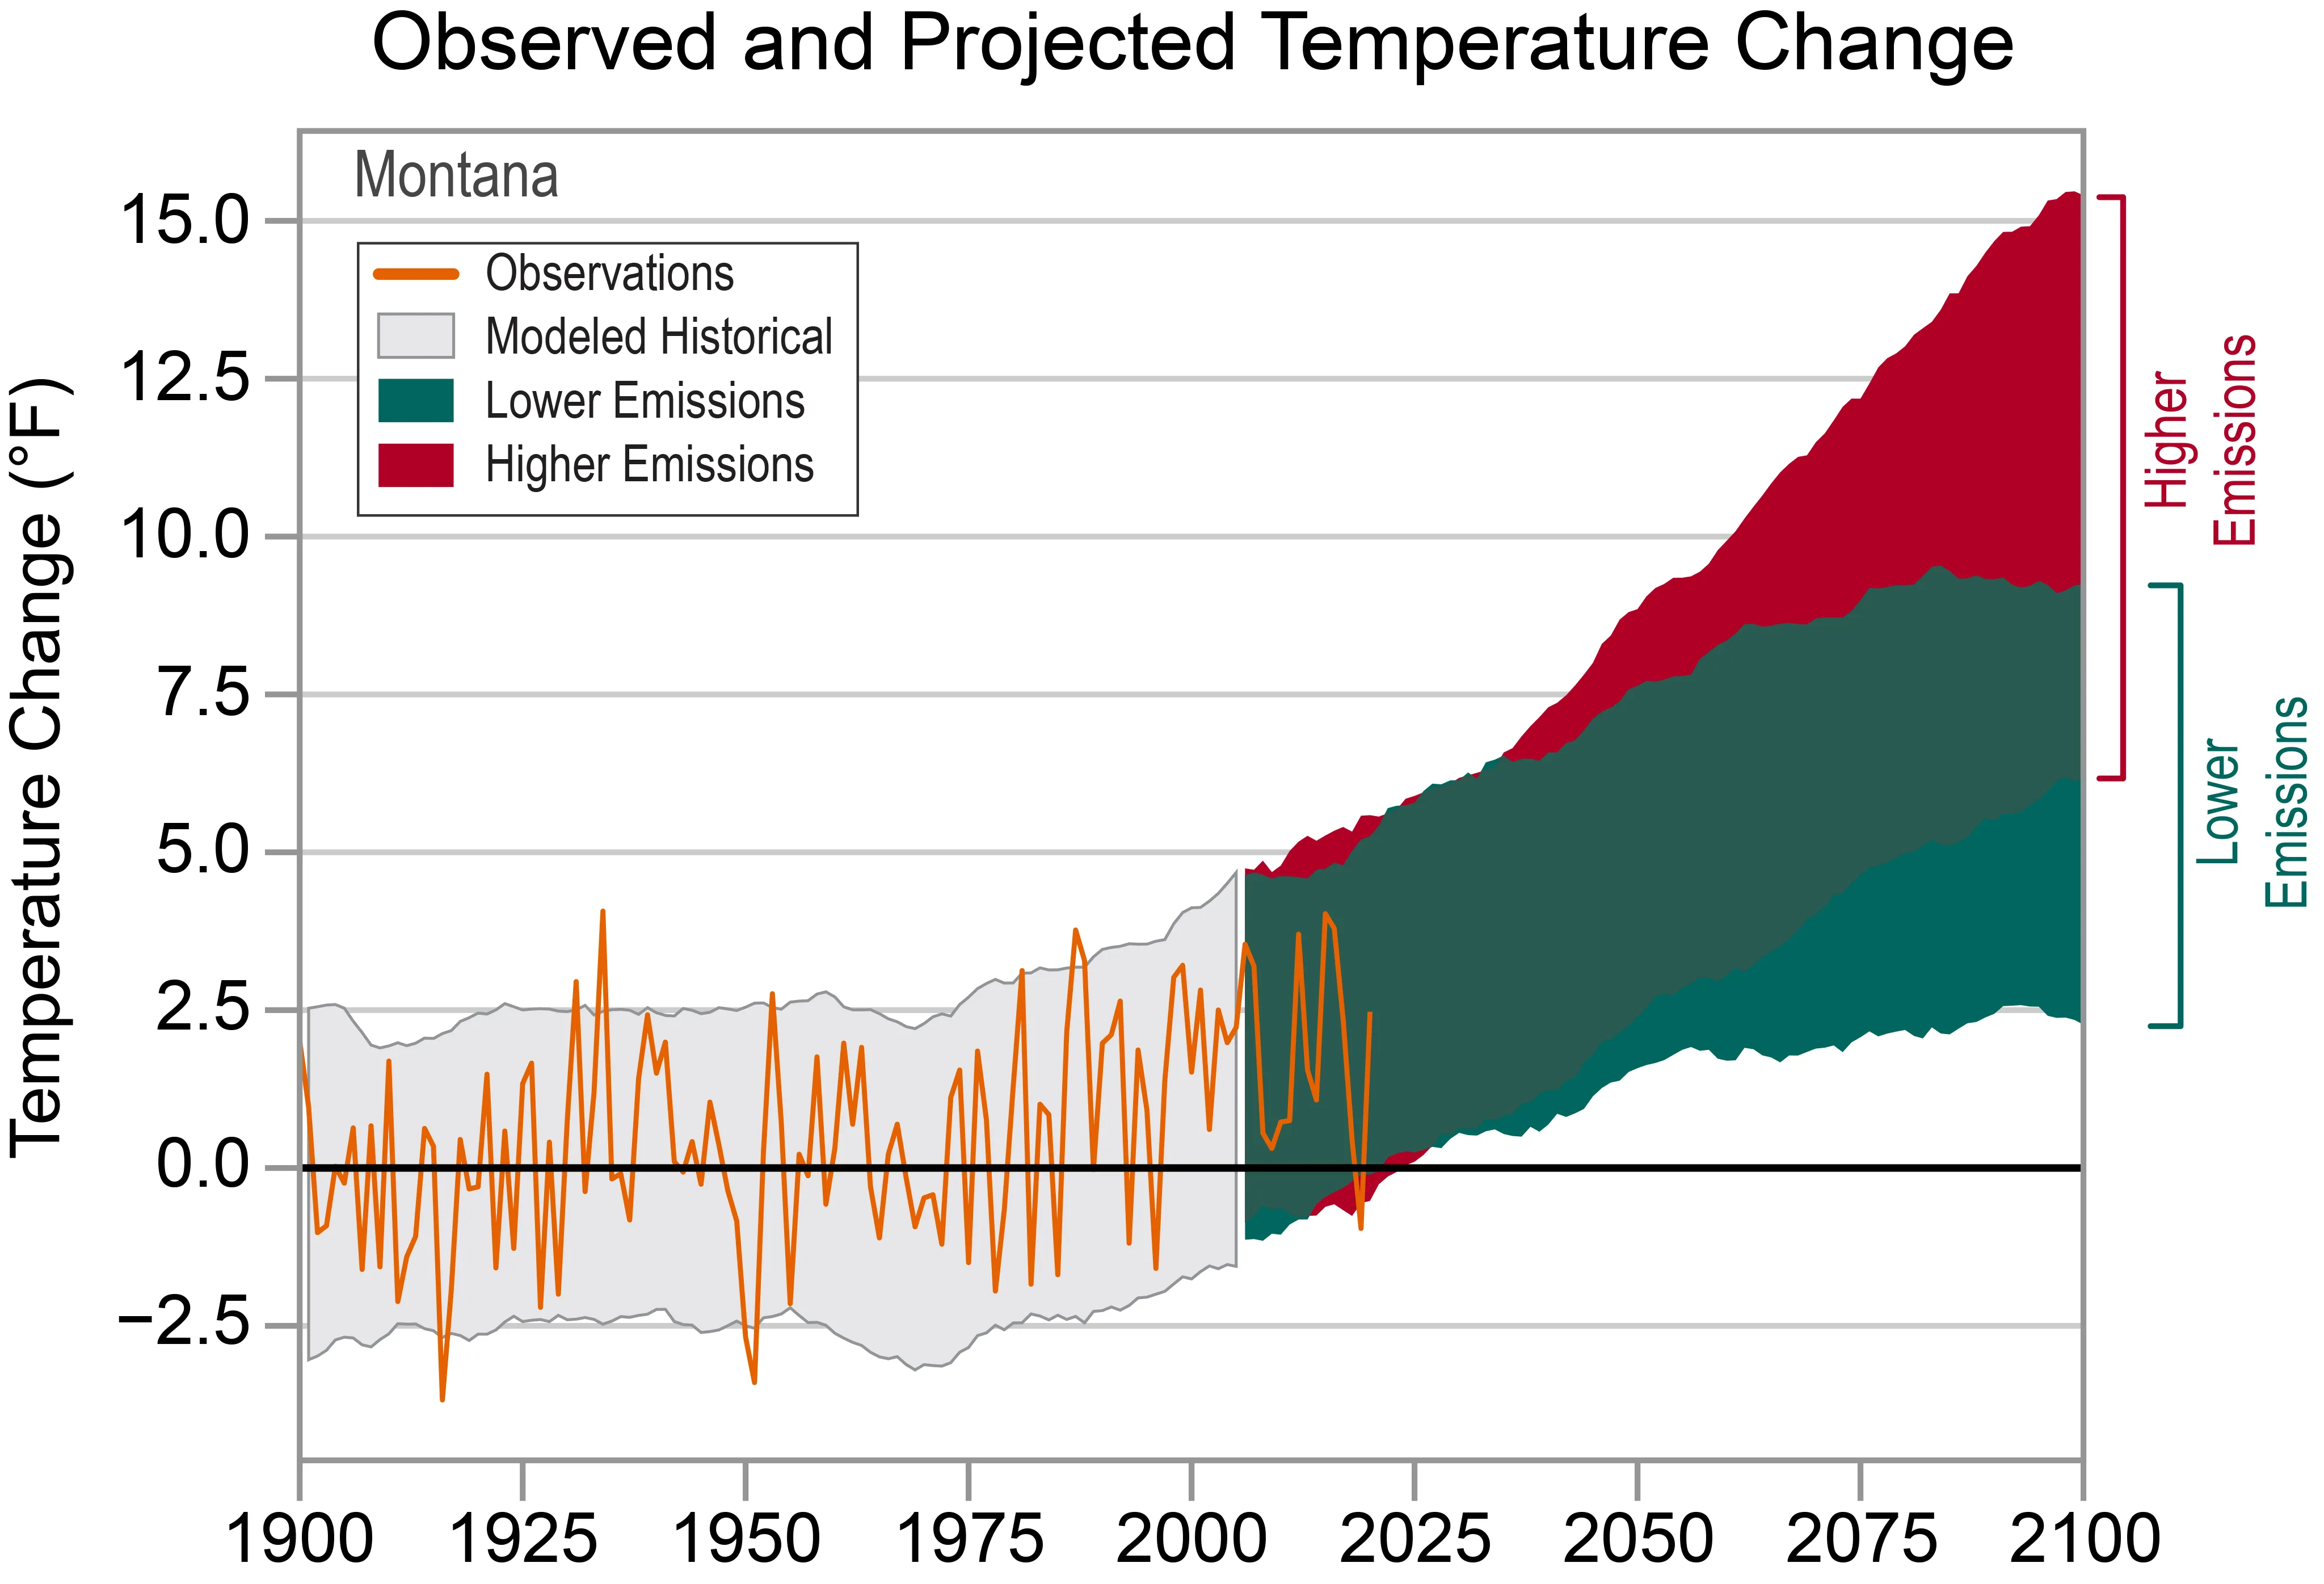 Observed and projected temperature changes for Montana Usa ClimateFigure 1: Observed and projected changes (compared to the 1901–1960 average) in near-surface air temperature for Montana. Observed data are for 1900–2020. Projected changes for 2006–2100 are from global climate models for two possible futures: higher emissions and lower emissions.
The increase in temperature is reflected in changes in extreme heat and cold events. The period between 2000 and 2007 saw the highest number of very hot days (maximum temperature of 95°F or higher) since the intense heat of the 1930s Dust Bowl era (Figure 2a). While Montana’s dry air and elevation typically limit warm nights, the number of warm nights (minimum temperature of 70°F or higher) during the 2000s was about 50% higher than the average from the 1940s through the 1990s, although the highest values were also during the Dust Bowl era (Figure 2b).
What to Eat in Fort Worth – A Culinary Deep Dive
Discover the Top Restaurants in Denver – A Culinary Journey
Discover Where to Visit in Las Vegas
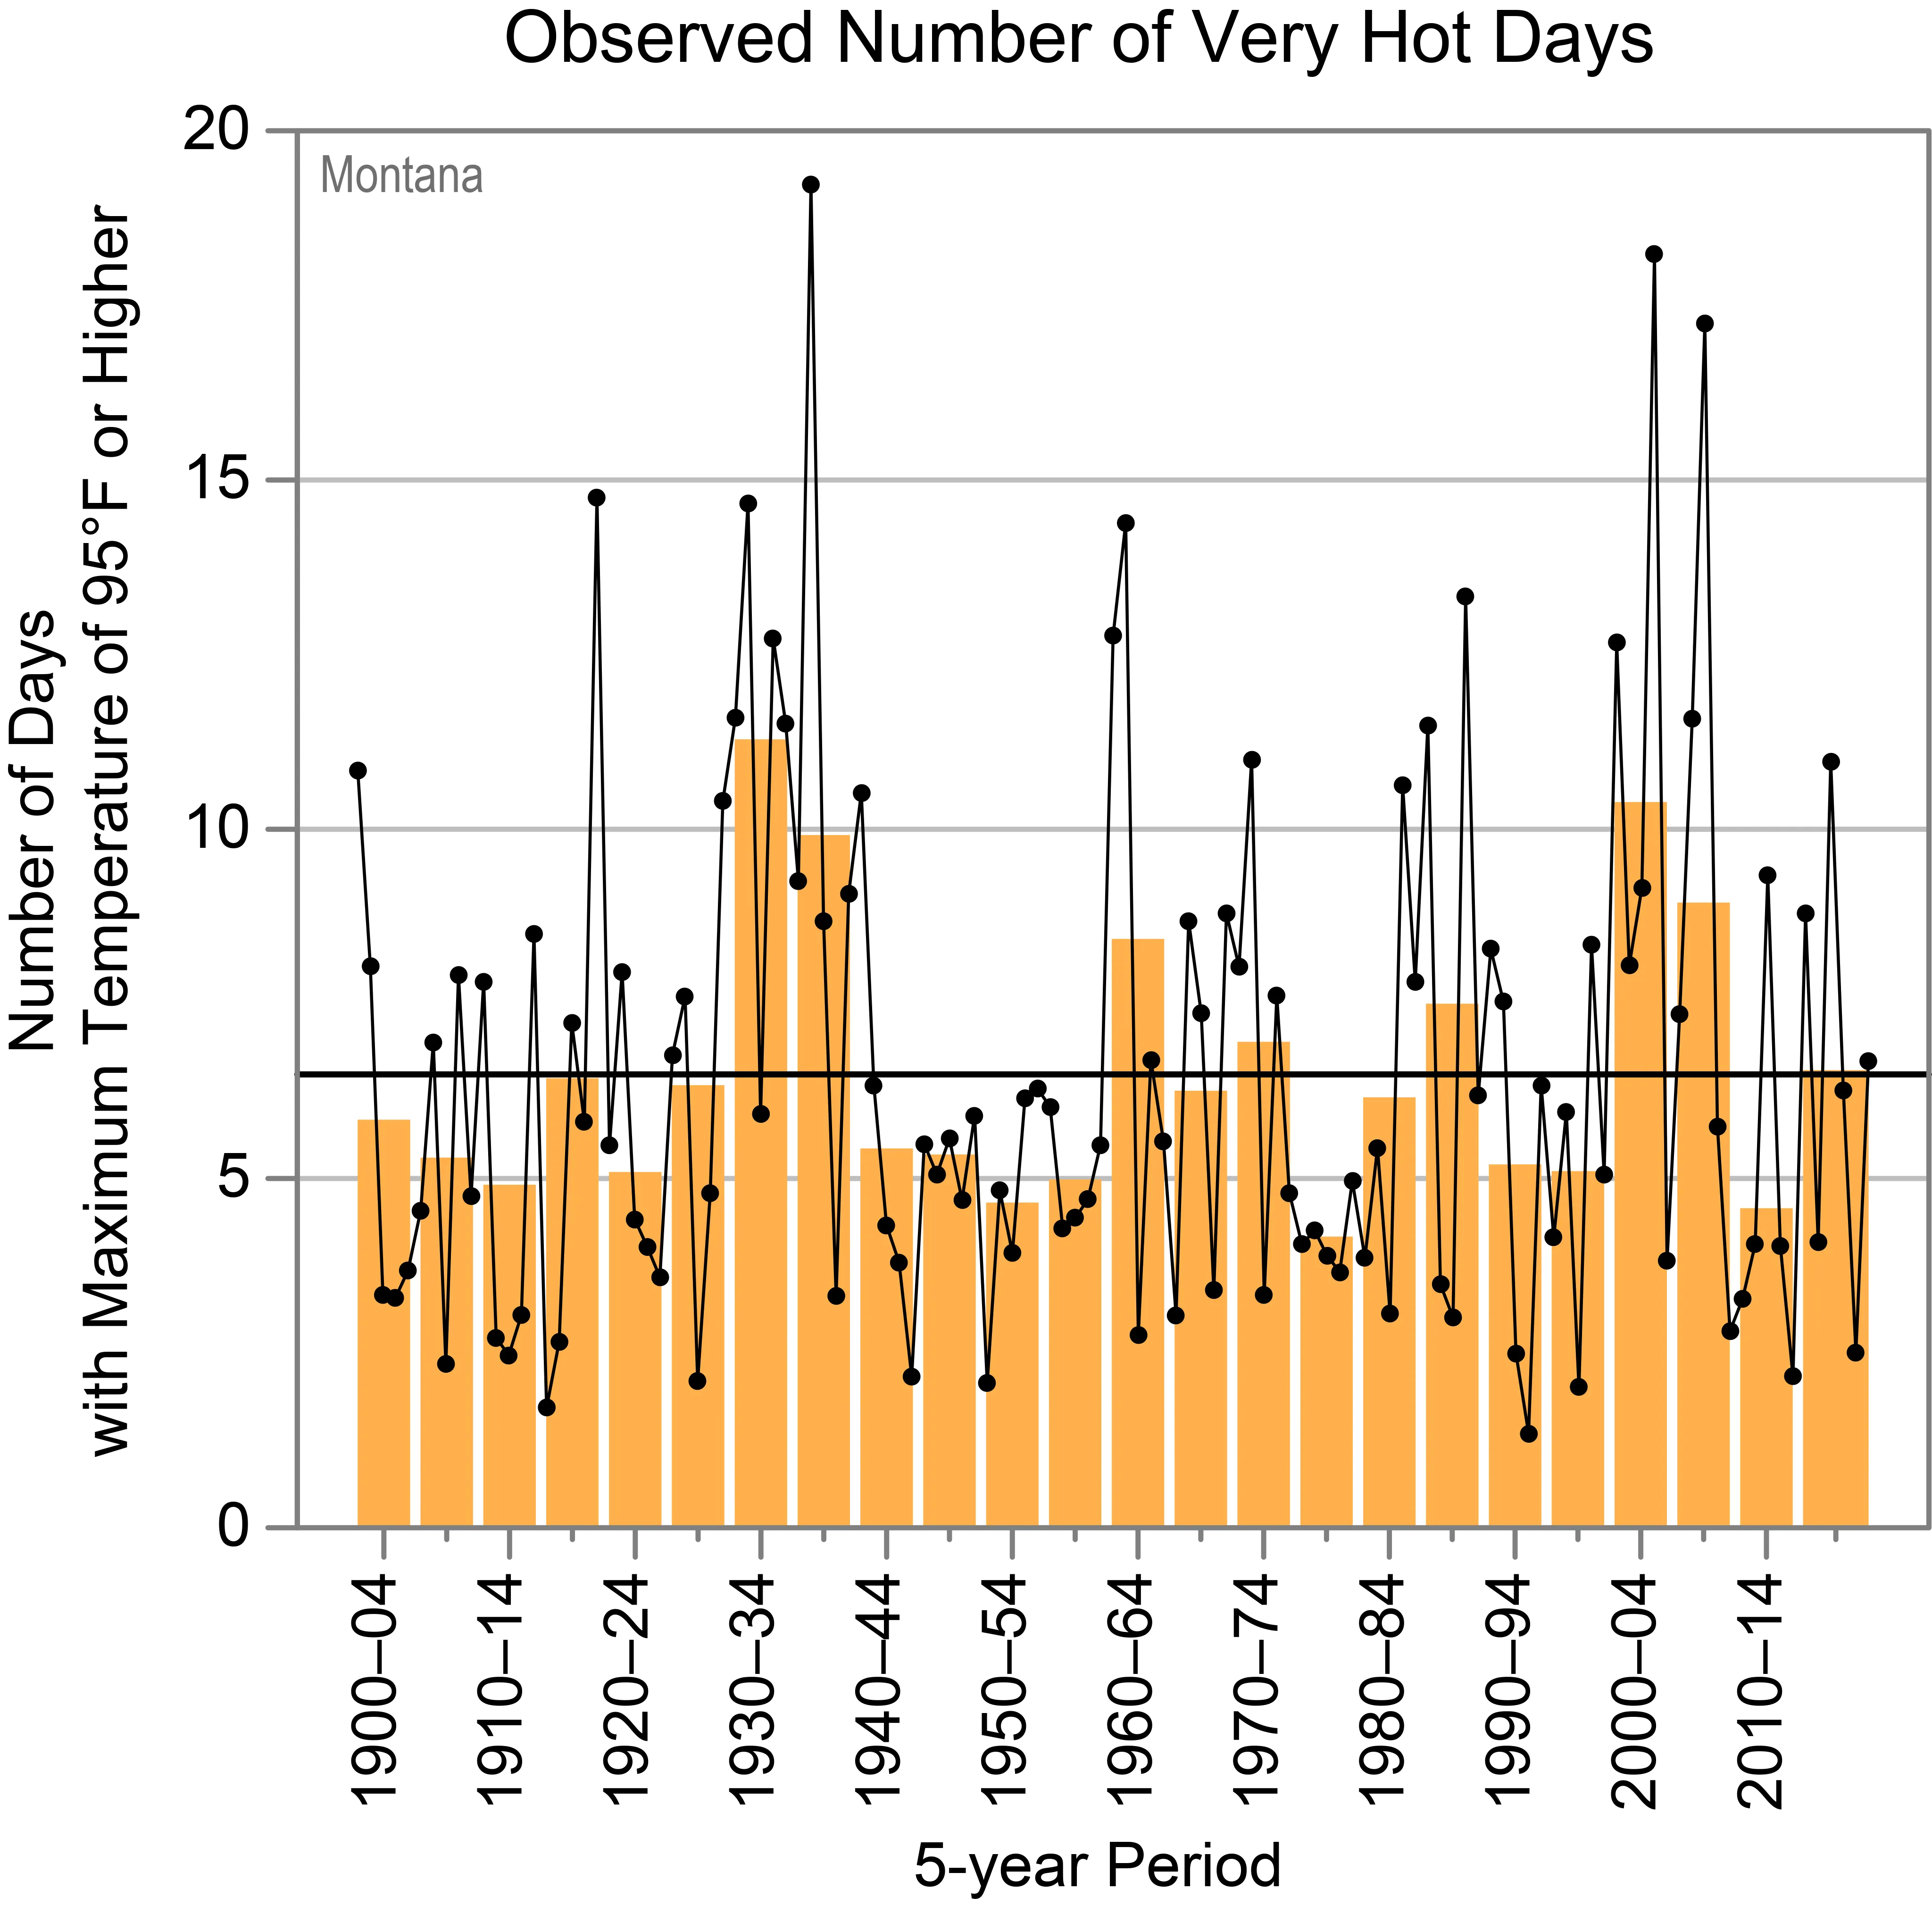 Observed annual number of very hot days in Montana Usa Climate
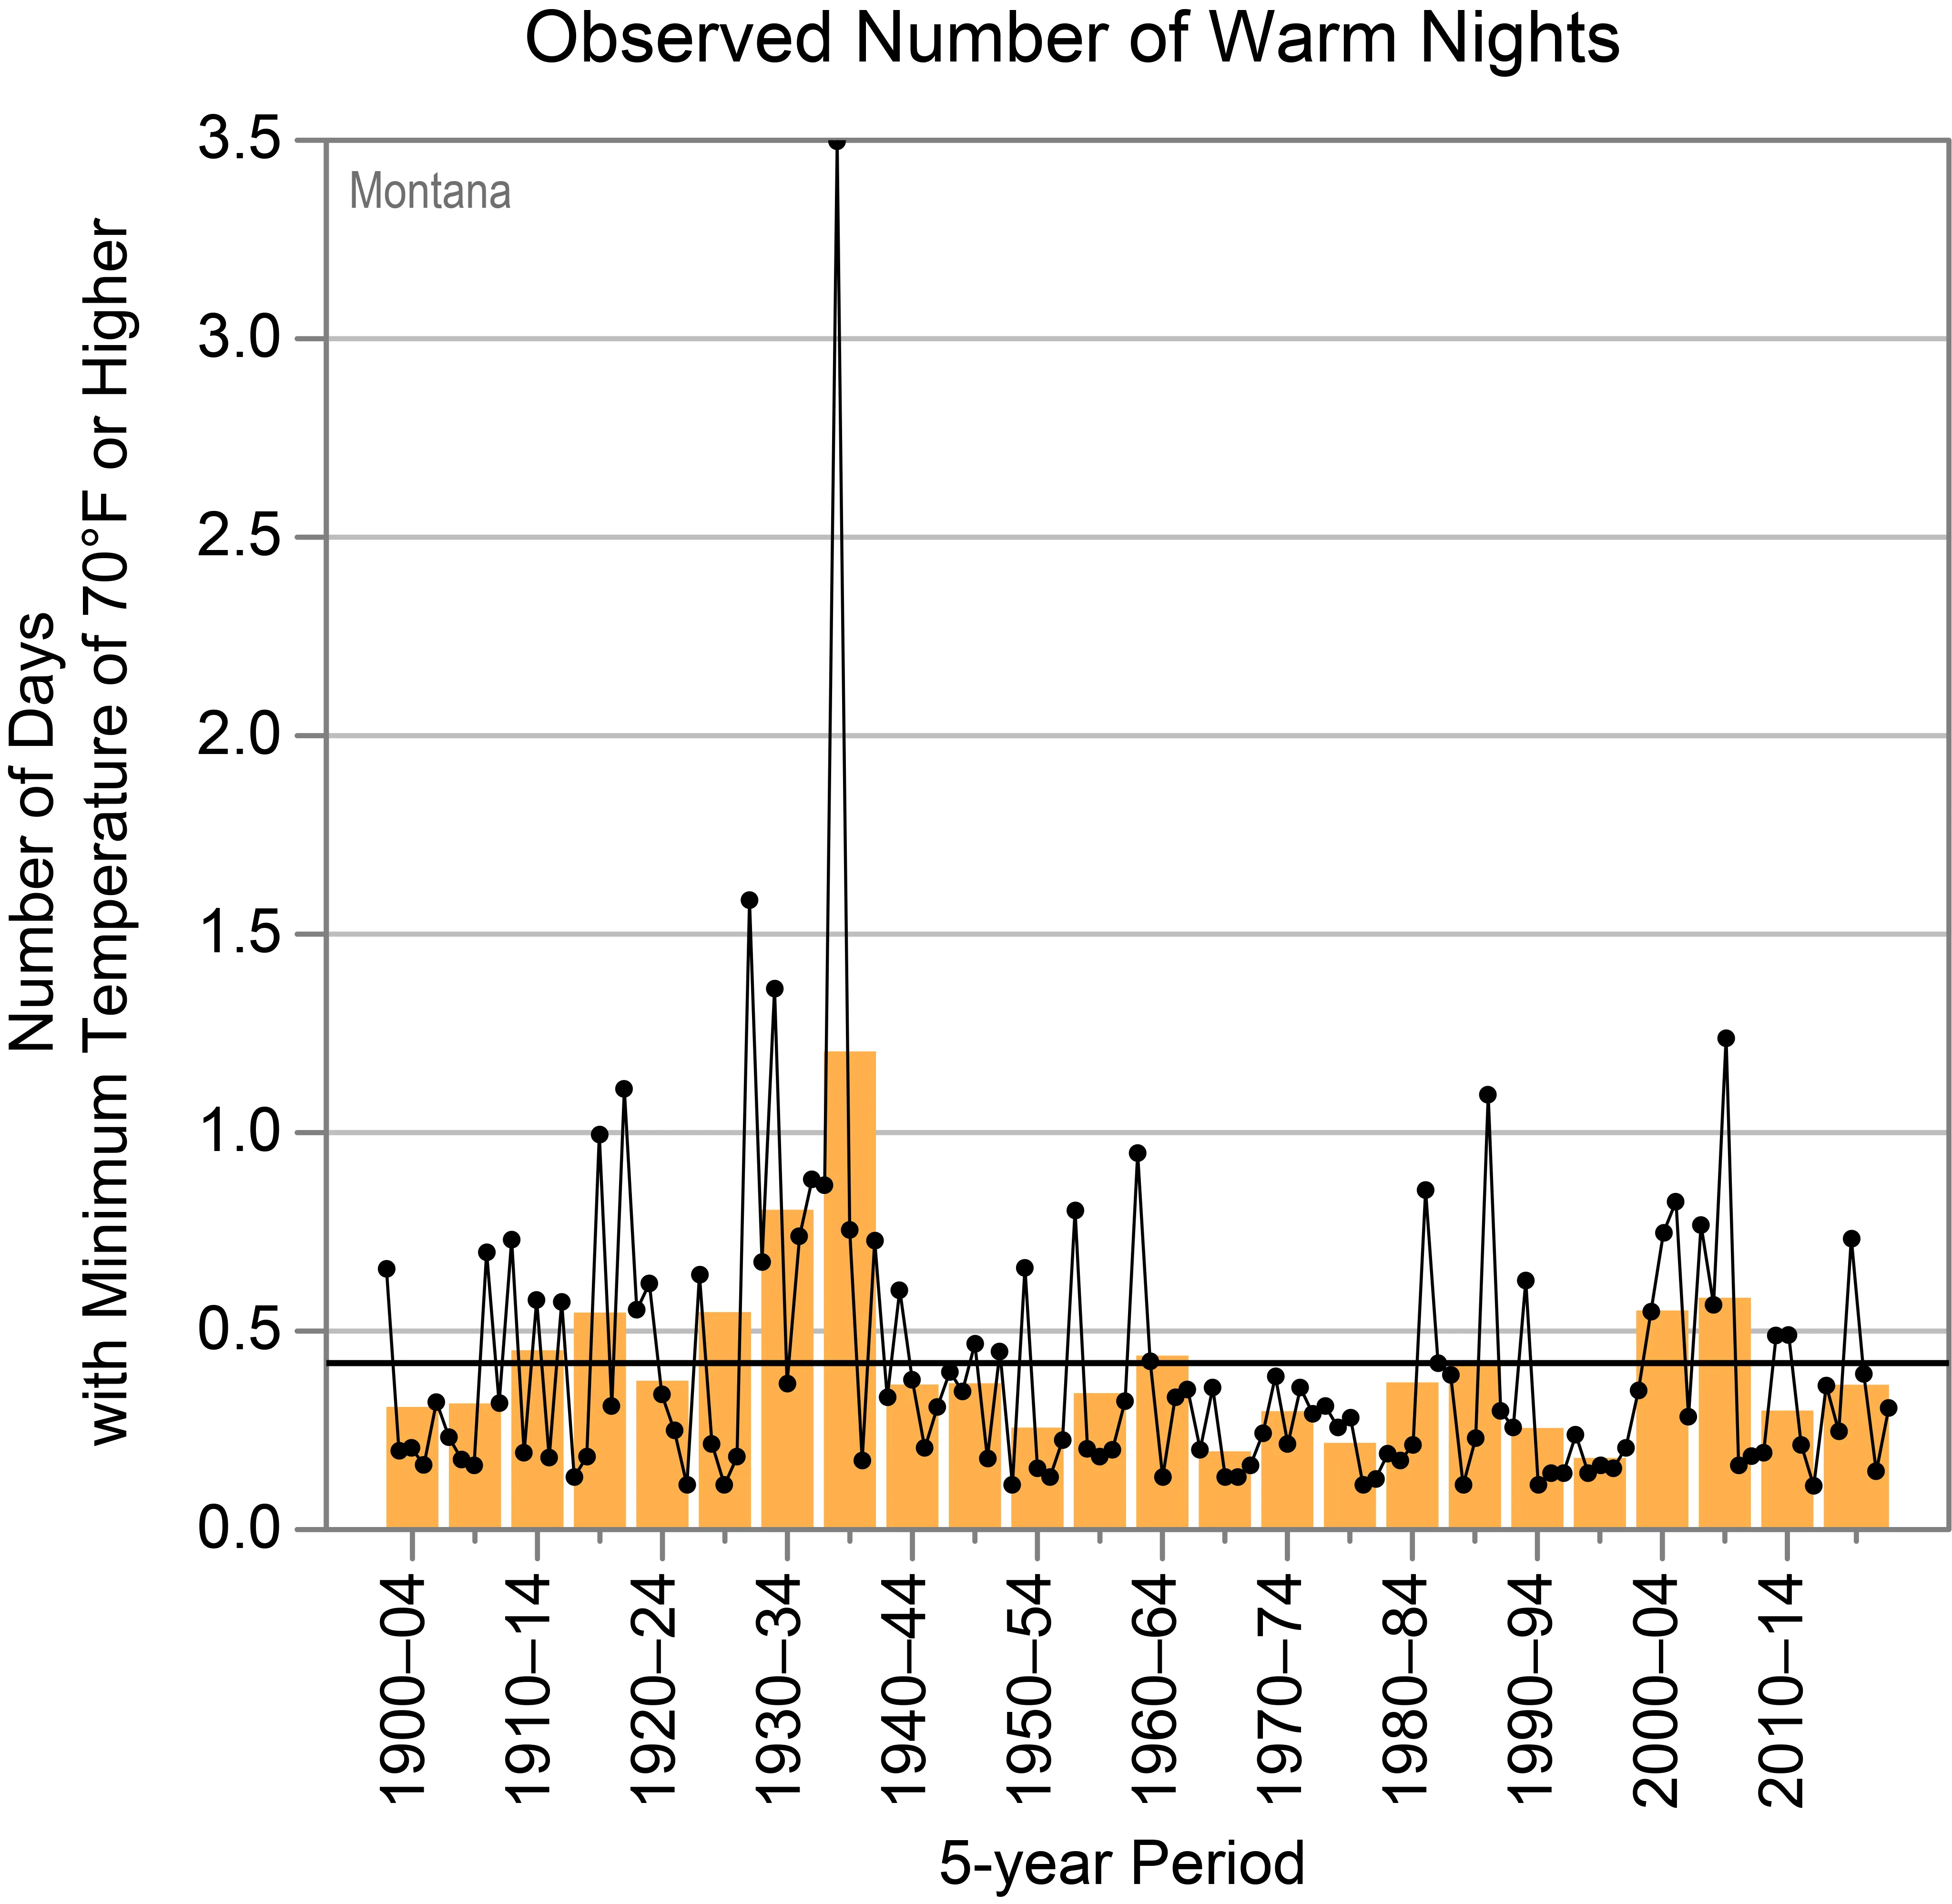 Observed annual number of warm nights impacting Montana Usa ClimateFigure 2: Observed trends in (a) very hot days and (b) warm nights for Montana from 1900 to 2020.
Conversely, Montana has experienced a below-average number of very cold days (maximum temperature of 0°F or lower) since 1985 (Figure 3). This decrease in extreme cold is indicative of winter warming trends. Both winter and summer average temperatures have shown pronounced increases, particularly in recent decades (Figures 4a and 4b).
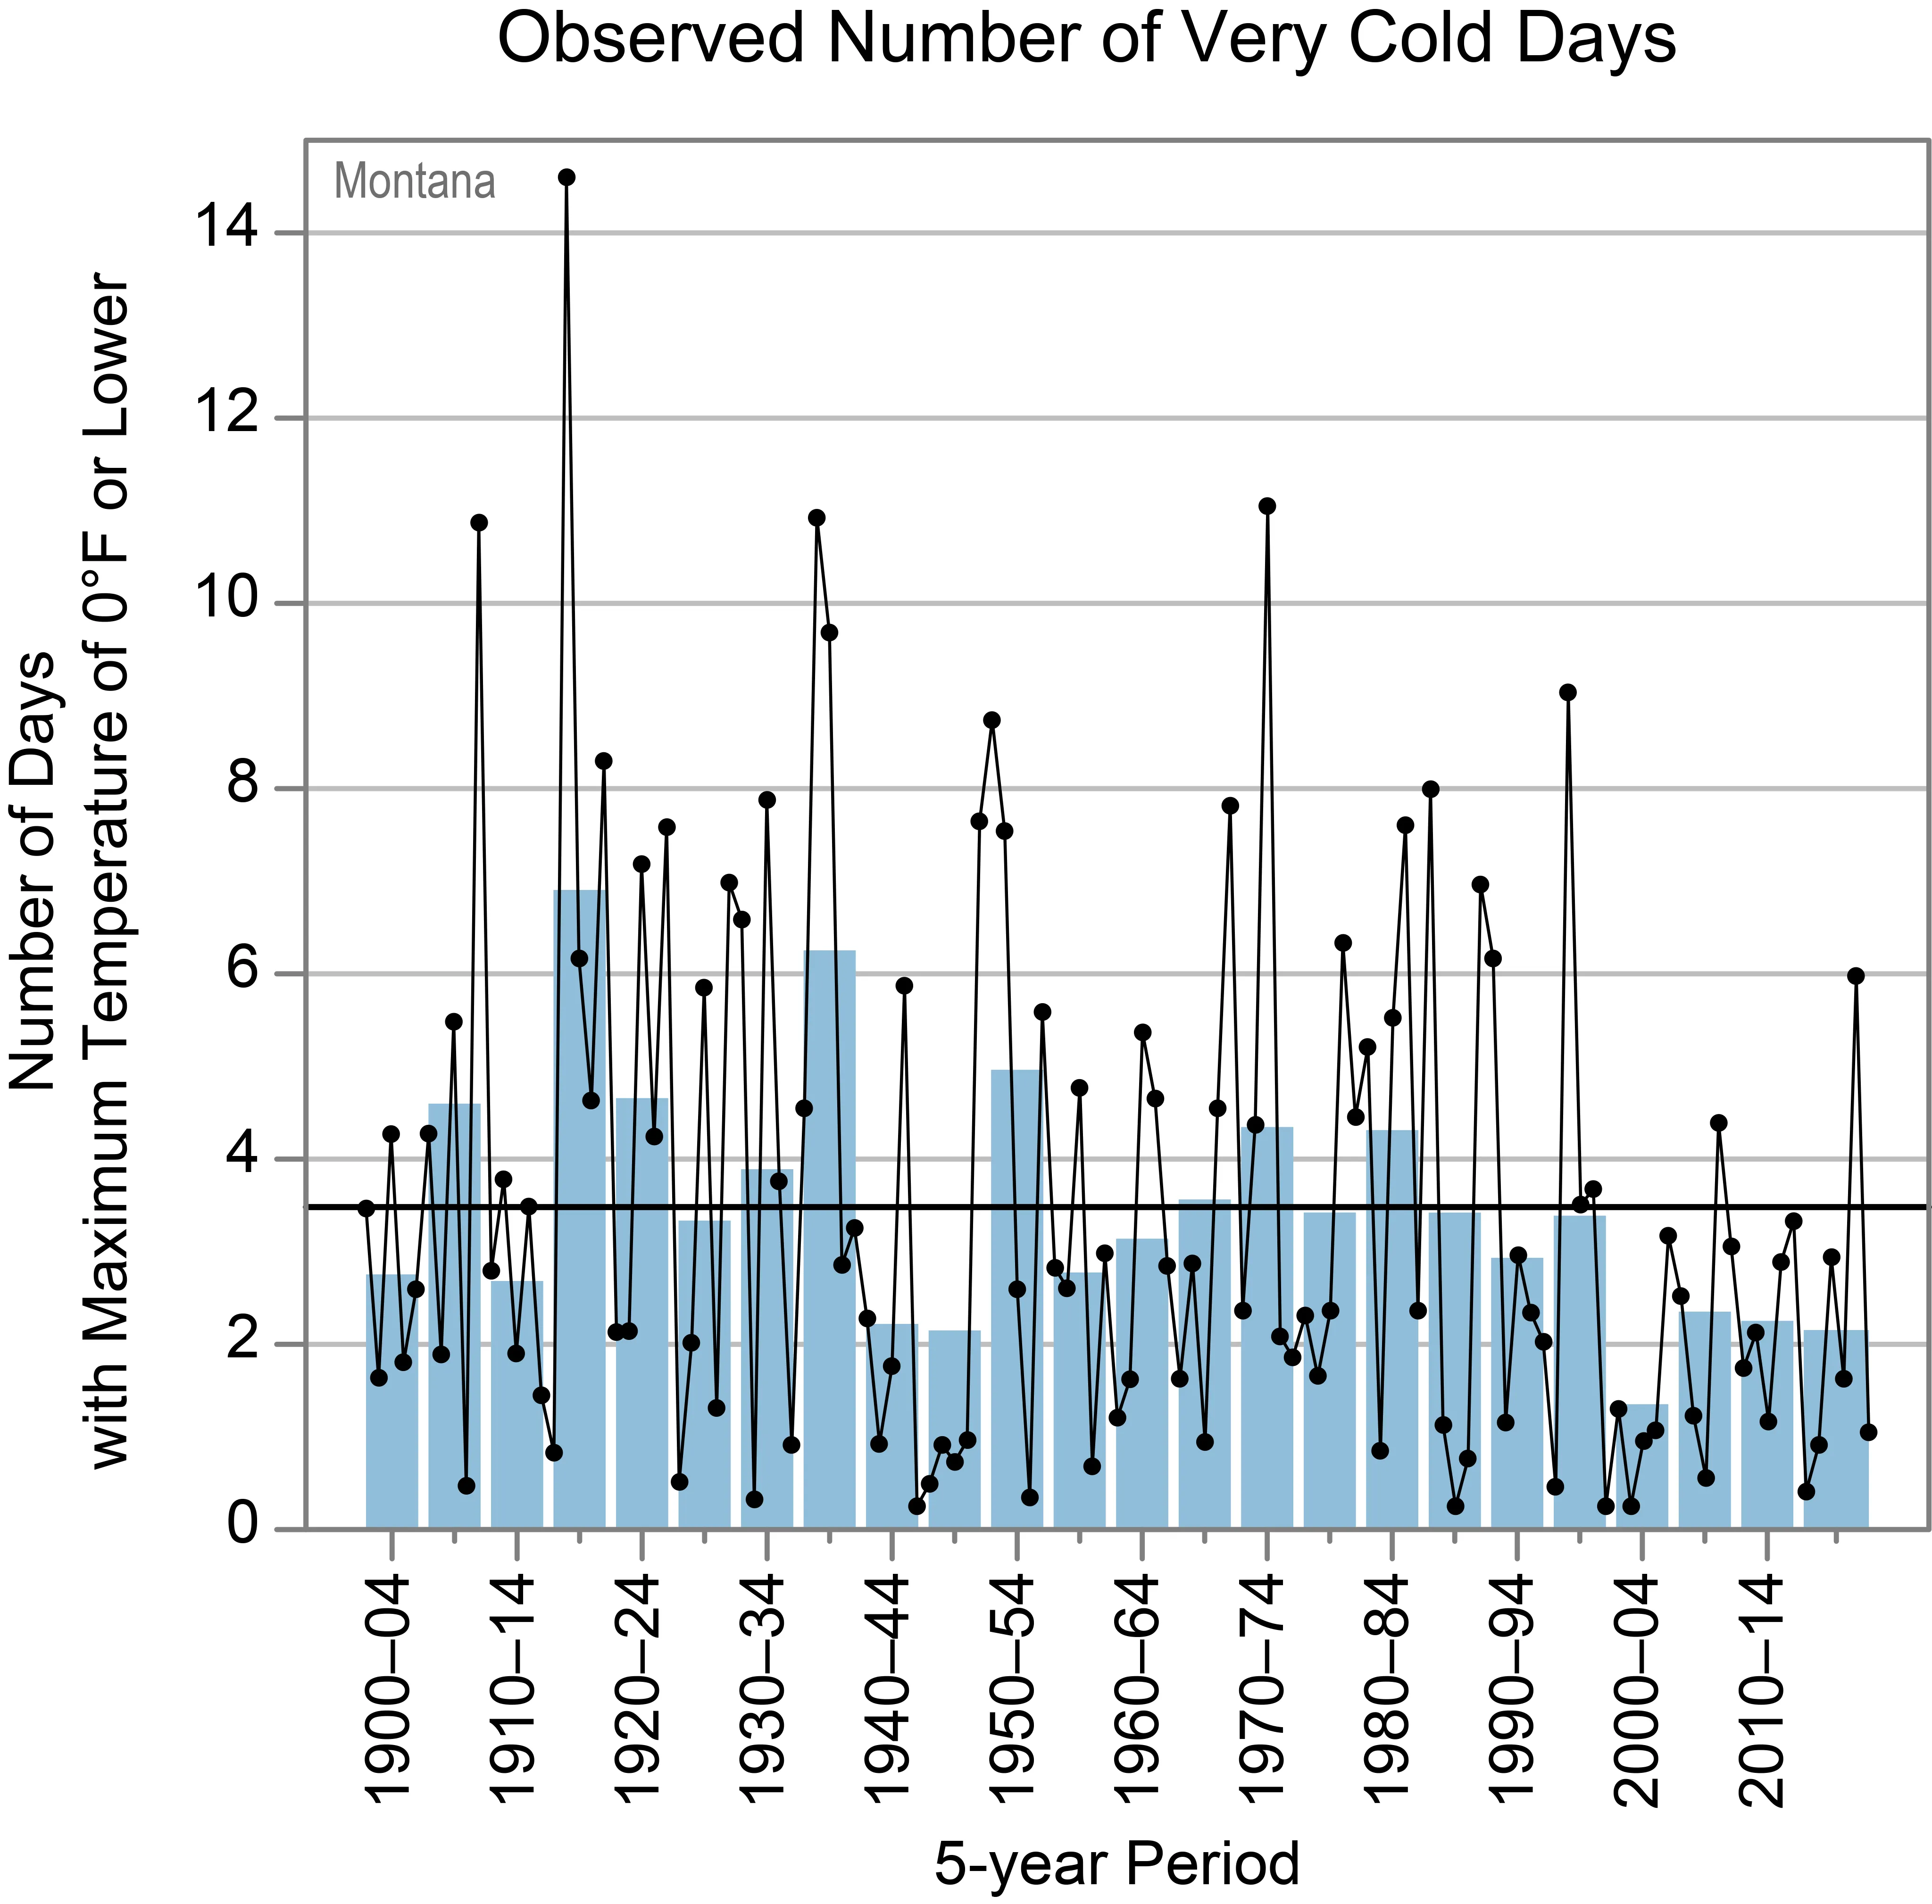 Observed annual number of very cold days in Montana Usa ClimateFigure 3: Observed annual number of very cold days for Montana from 1900–2020.
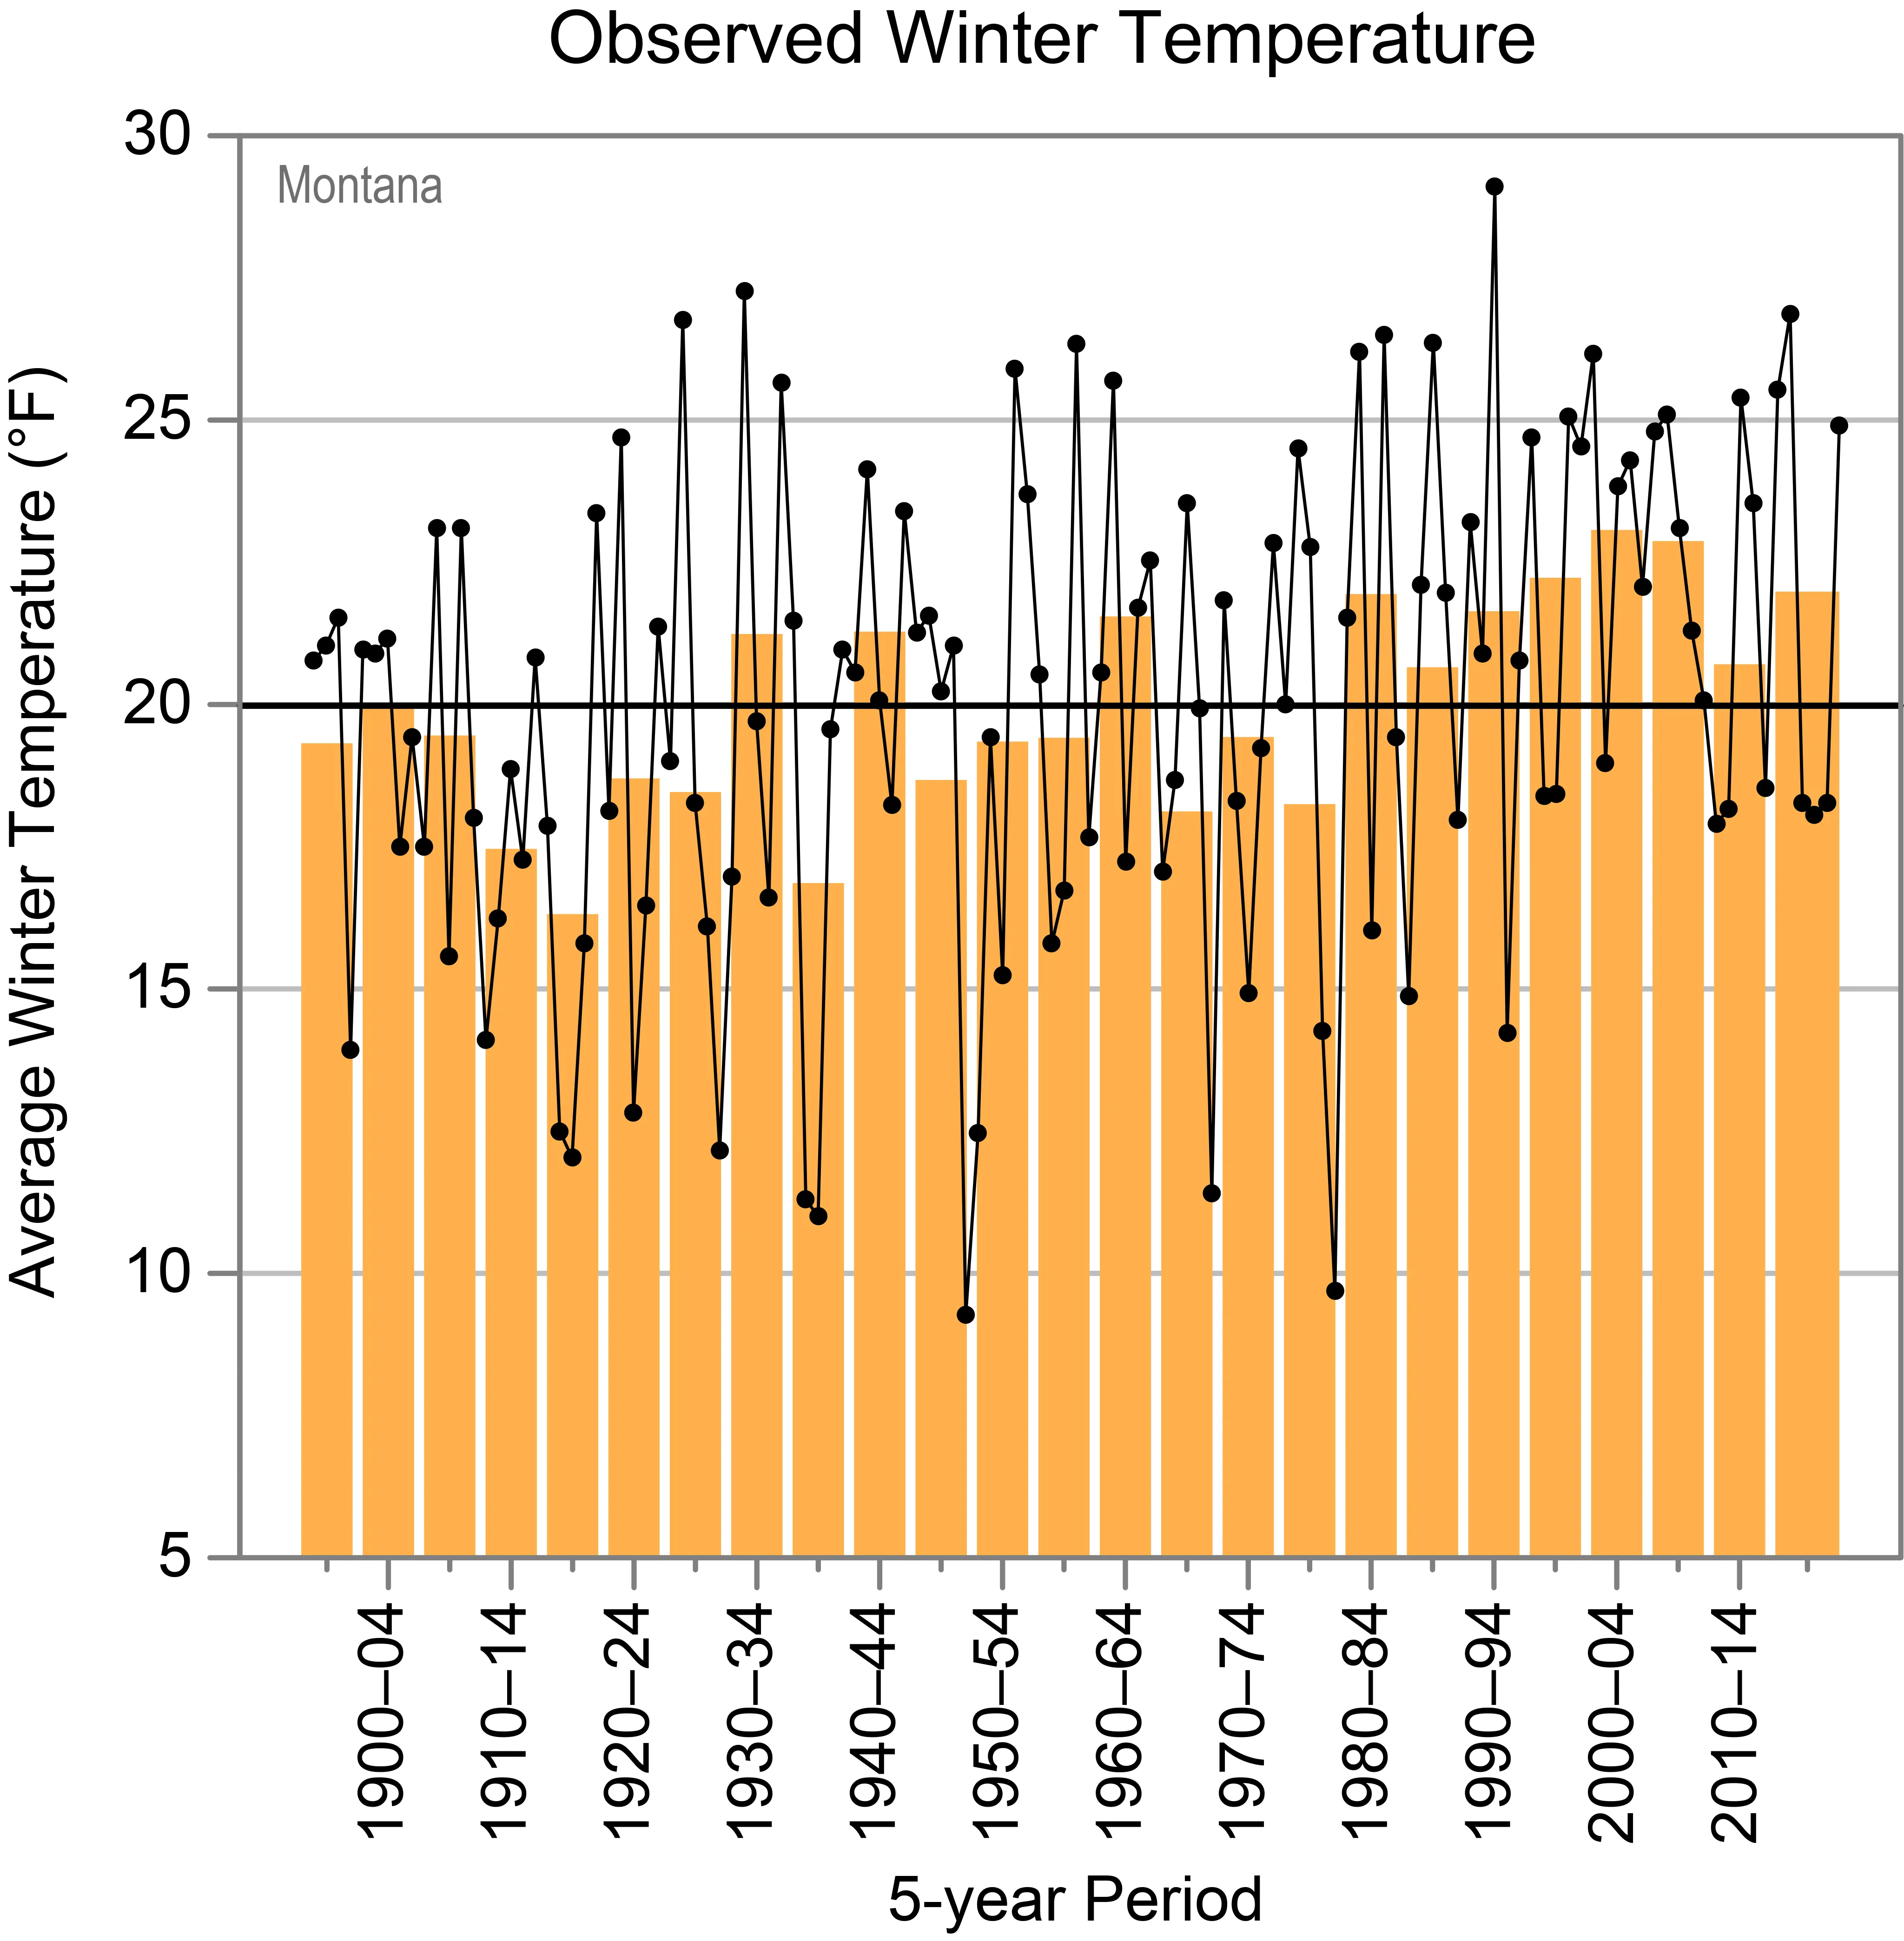 Observed winter temperature trends in Montana Usa Climate
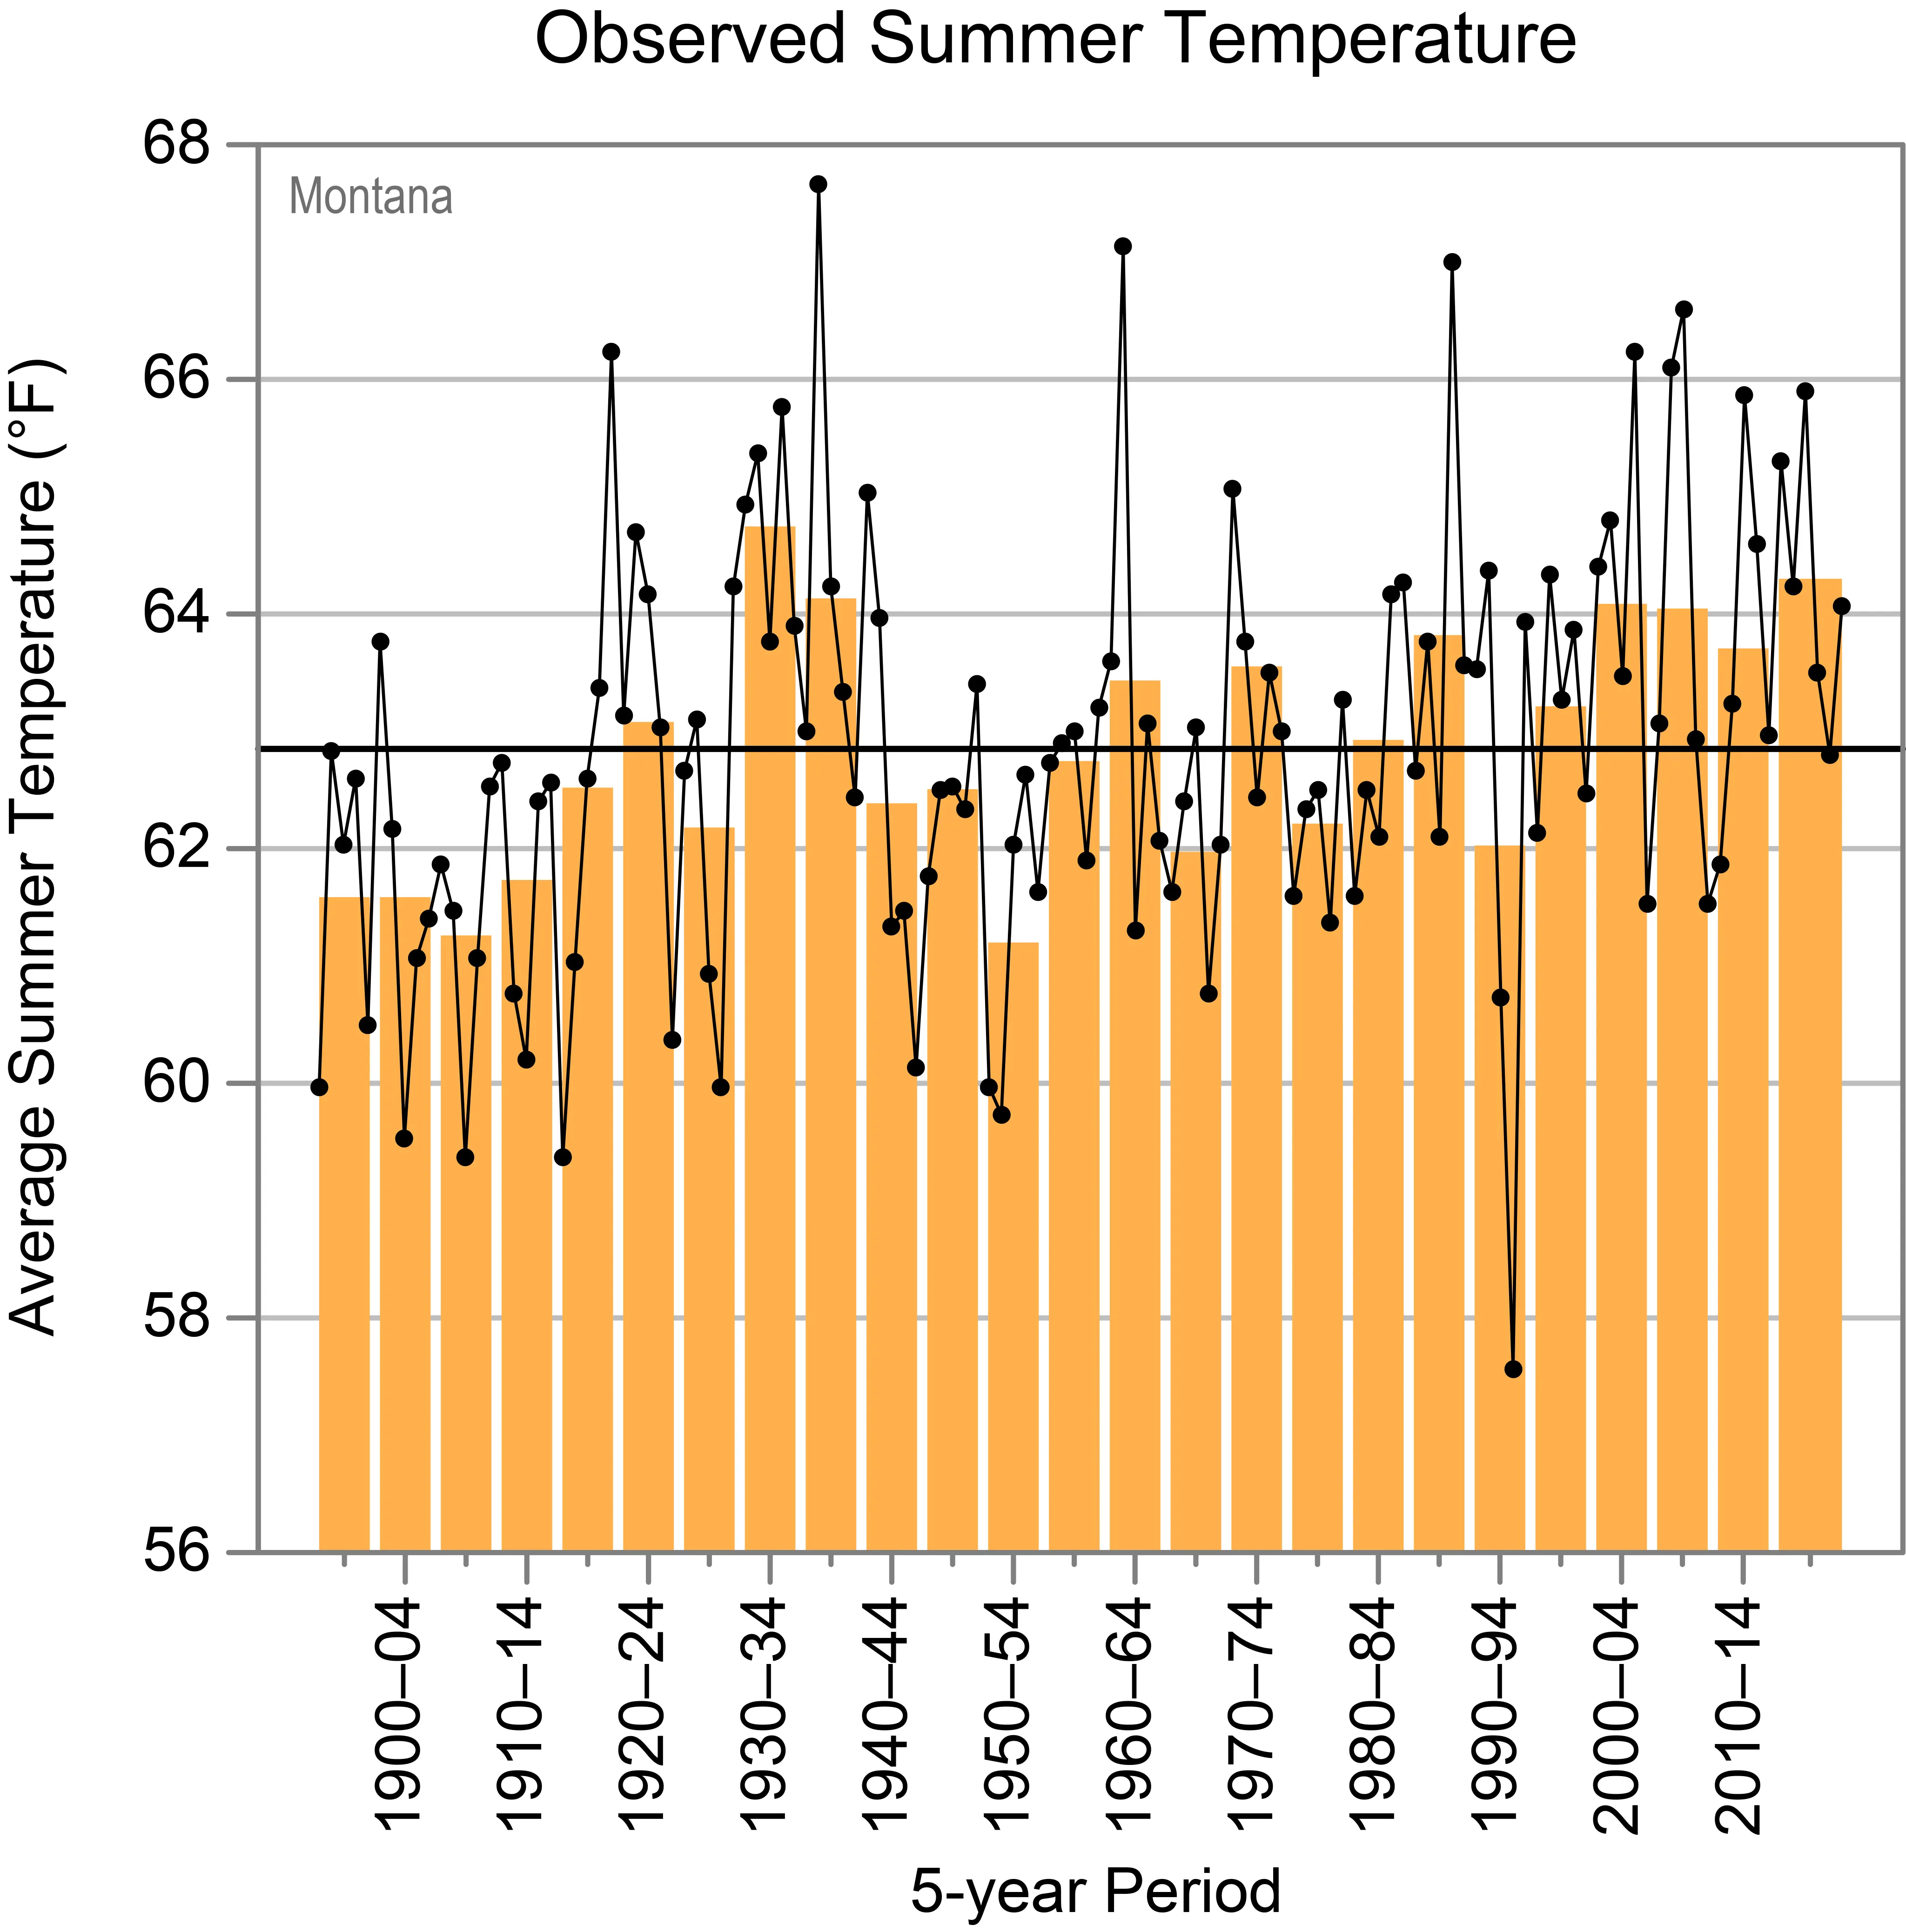 Observed summer temperature trends in Montana Usa ClimateFigure 4: Observed (a) winter and (b) summer average temperatures for Montana from 1895–96 to 2019–20 and 1895 to 2020, respectively.
Precipitation and Water Resources
Precipitation patterns across the Montana Usa Climate vary dramatically due to the state’s topography. Annual totals can range from less than 7 inches in the lowlands and valleys in the south to over 35 inches in the mountainous northwest. Higher mountain locations, particularly in the west, can receive much more, with late-season snow depths often exceeding 40 inches of water content (Figure 5). This mountain snowpack is a critical reservoir for the state’s water supply.
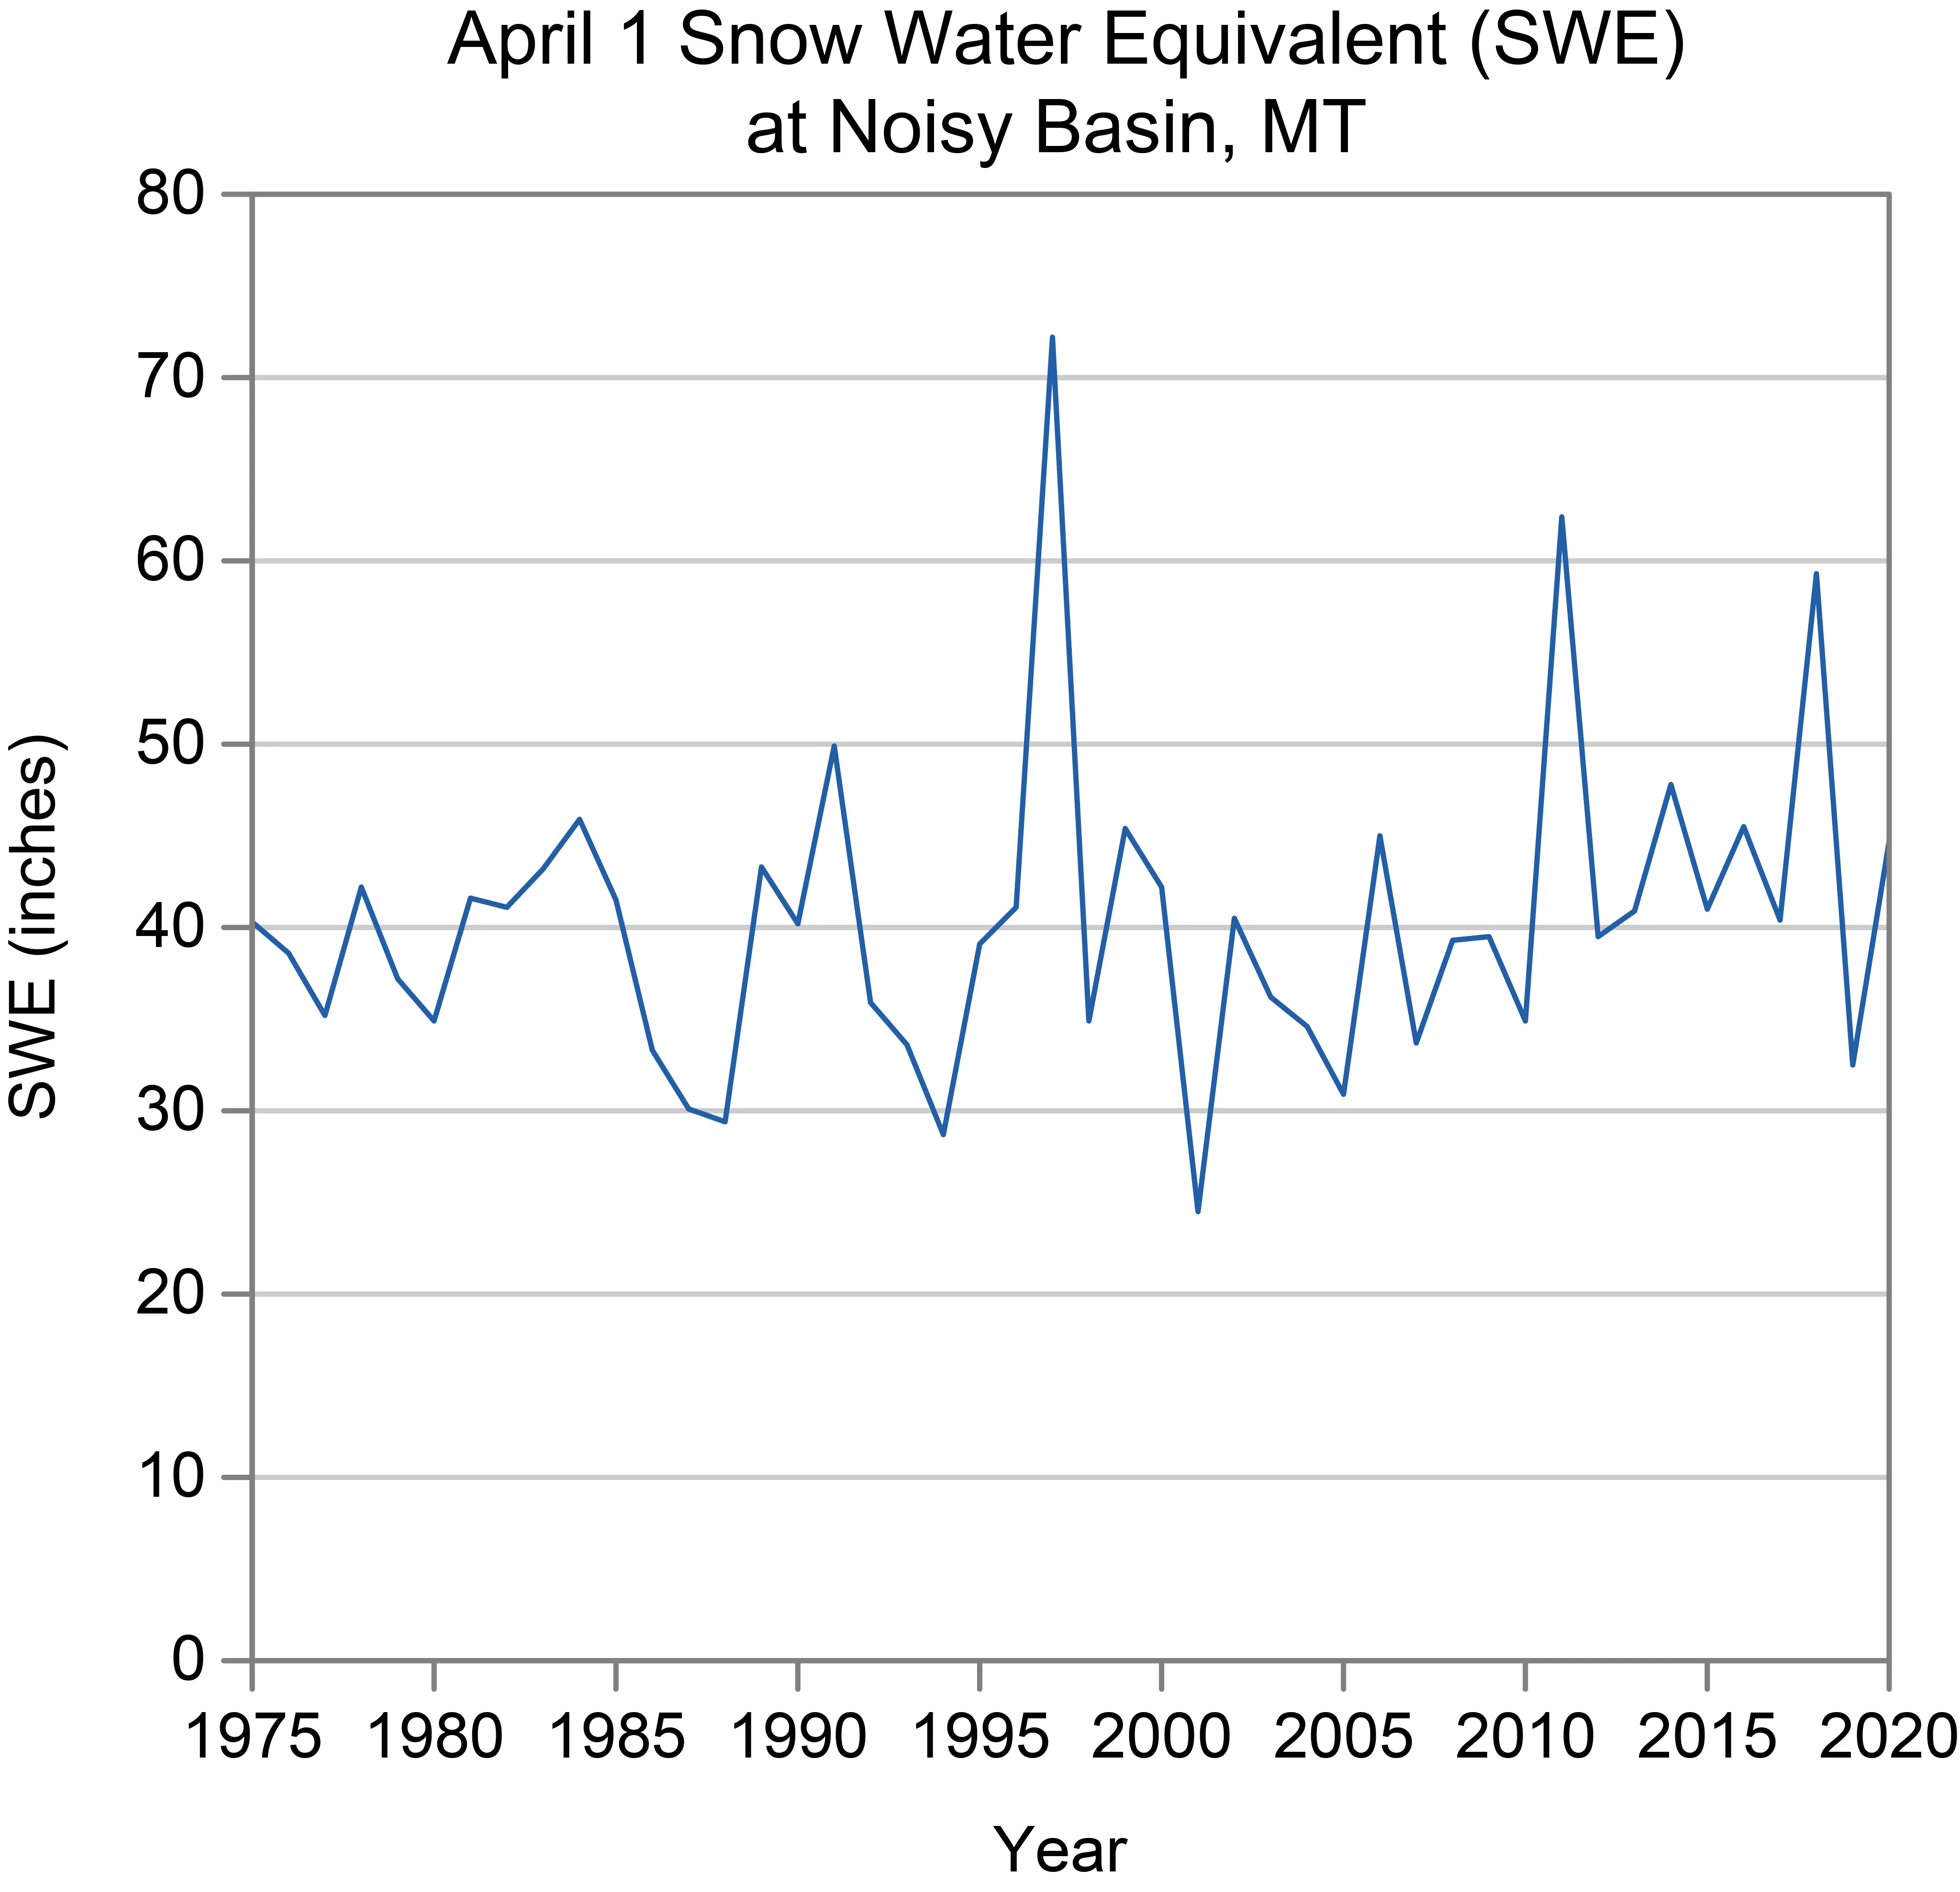 April 1 Snow Water Equivalent (SWE) at Noisy Basin, MT, related to Montana Usa ClimateFigure 5: Variations in the April 1 snow water equivalent (SWE) at the Noisy Basin, Montana, SNOTEL site from 1975 to 2020.
Most of Montana’s precipitation historically falls during the summer months, often from thunderstorms. However, some mountain areas see their peak precipitation during winter and spring, primarily due to heavy snowfall generated as air flows over the mountains. Statewide annual precipitation has shown wide variation throughout the record, with wet periods in the late 1890s, early 1910s, and early 2010s, and dry periods in the 1930s and early 2000s (Figure 2c). The number of 1-inch extreme precipitation events has generally remained near the long-term average since 1970 (Figure 2d), although localized intensity can vary greatly.
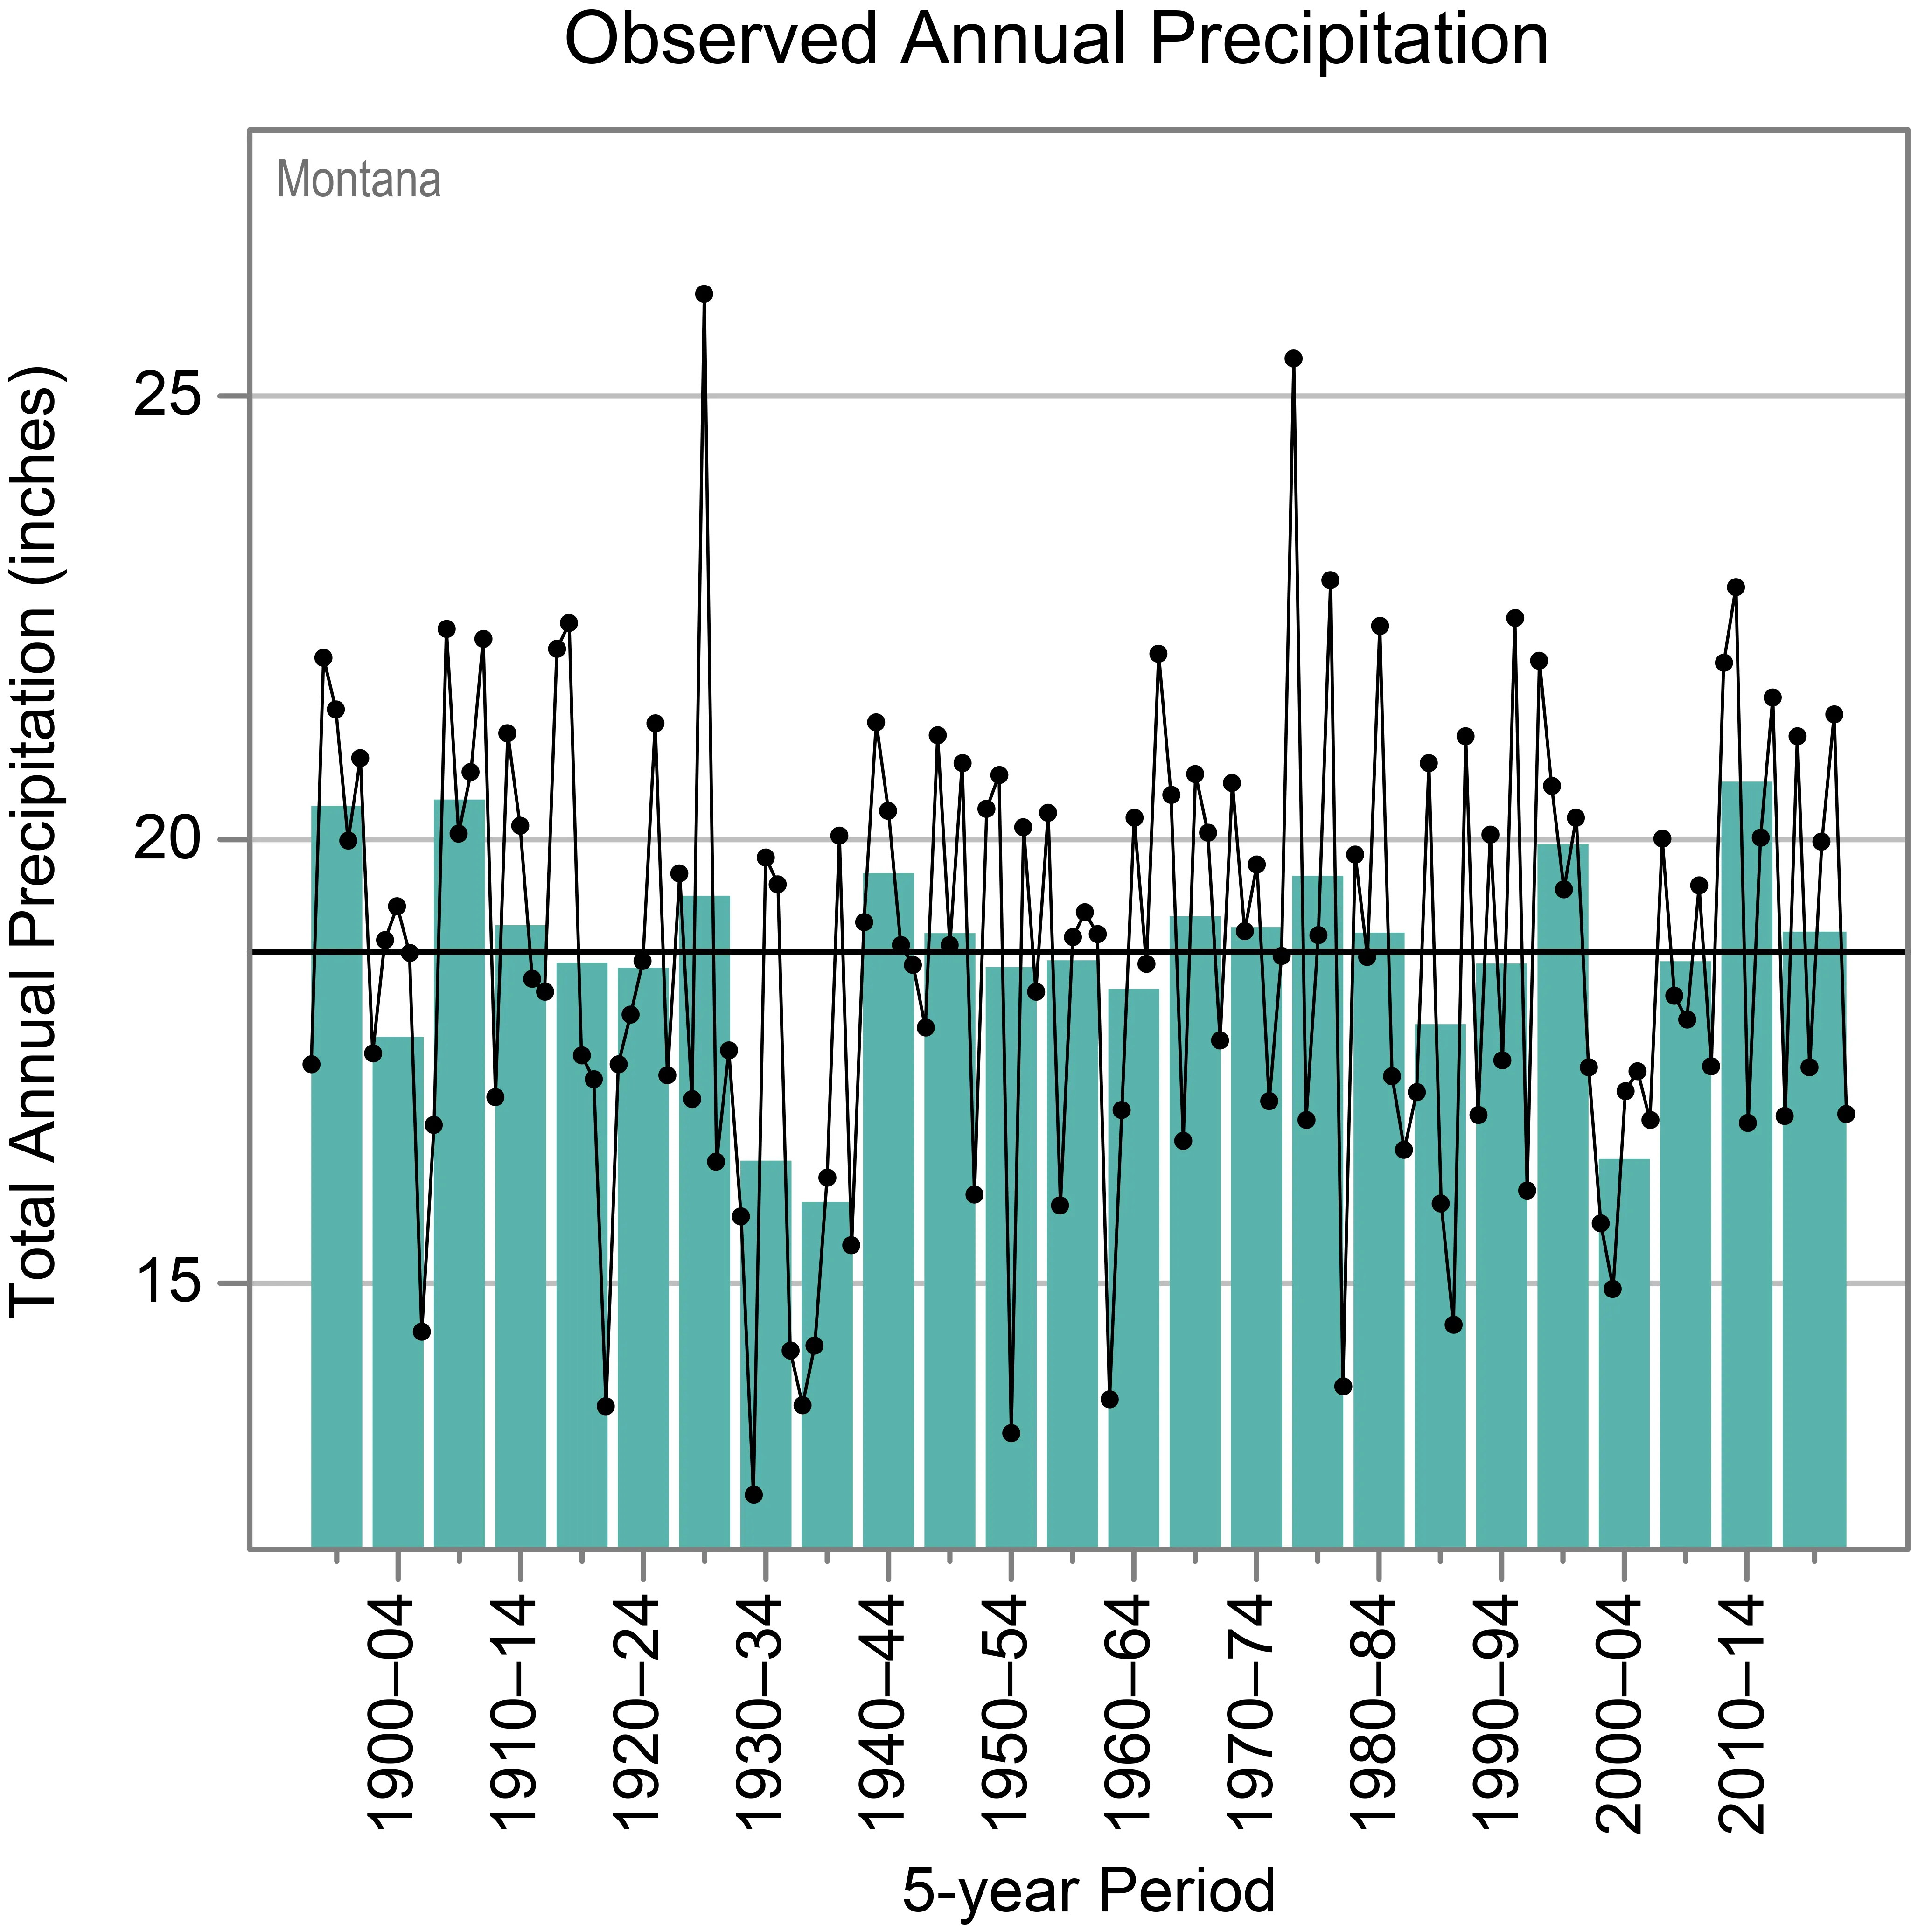 Observed annual precipitation trends in Montana Usa Climate
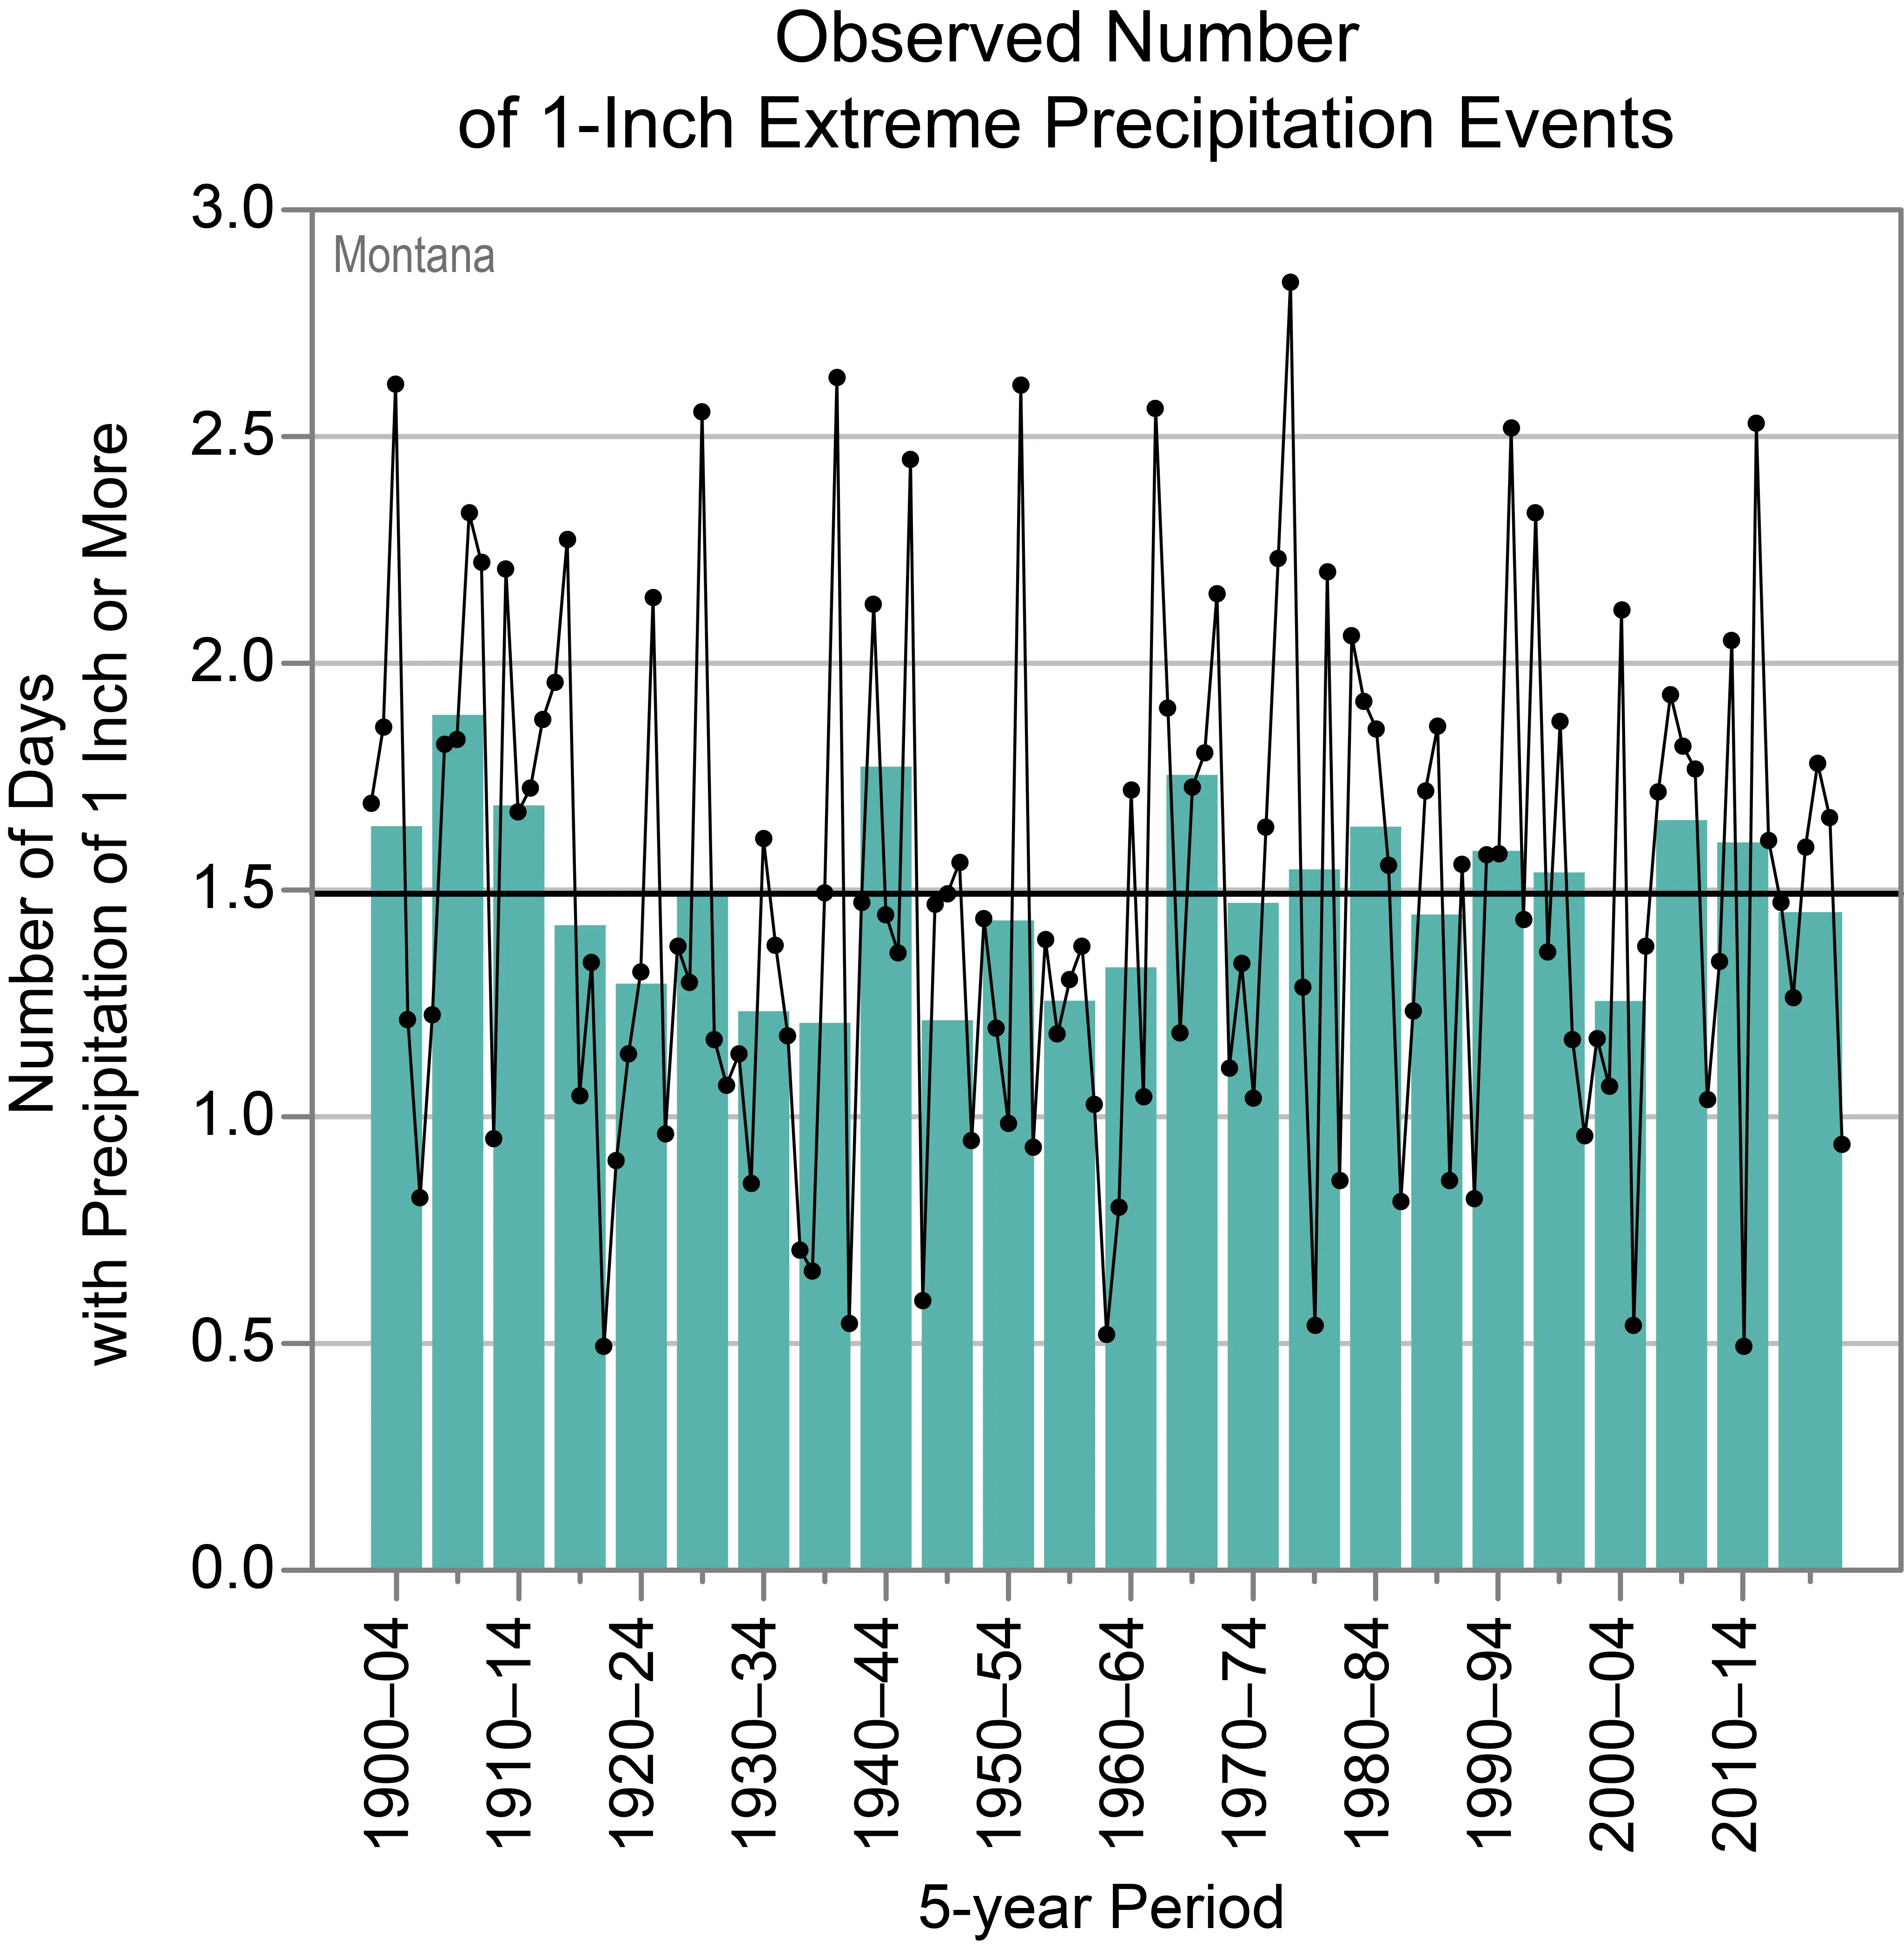 Observed number of 1-inch extreme precipitation events in Montana Usa ClimateFigure 2 (cont.): Observed trends in (c) total annual precipitation and (d) annual number of 1-inch extreme precipitation events for Montana.
Montana holds a unique hydrological position as a major water source for vast regions. Rivers originating in Montana feed into three different oceans: the Atlantic via the Gulf of Mexico (Missouri River), the Arctic via Hudson Bay (Belly, Saint Mary, and Waterton Rivers), and the Pacific (Columbia River). Streamflow in these vital river systems is highly dependent on the timely meltwater release from the winter and spring snowpack in the mountains during late spring and summer. Changes in snowpack accumulation and melt timing directly impact water availability for downstream states and various industries within Montana.
Extreme Weather Events
The diverse Montana Usa Climate is prone to a range of extreme weather phenomena. During the summer, frequent thunderstorms can bring hazards such as hail, lightning, and strong winds. Tornadoes are less common but do occur, almost exclusively in the eastern third of the state. Due to its northern latitude and the lack of significant mountain barriers to the north, Montana is particularly vulnerable to severe winter storm systems. These can bring heavy snowfall, high winds, and dangerously low wind chill temperatures. Blizzards are most frequent in the northeastern part of the state, occurring around five times annually.
Eastern Montana can experience intensely cold temperatures. The state holds the record for the lowest temperature ever recorded in the contiguous 48 states: -70°F, observed at Rogers Pass in 1954. Conversely, the state also experiences significant summer heat waves. The all-time high temperature record stands at 117°F, recorded at Medicine Lake and Glendive in 1937 and 1893, respectively. This extreme heat, surpassing records in states like Florida, is attributed to the combination of dry air and downslope winds that heat up as they descend in the lower elevations of the eastern plains.
Chinook winds, characteristic warm, dry winds flowing down the eastern slopes of the Rocky Mountains, pose a unique hazard during winter. While they can bring dramatic, sometimes pleasant, temperature increases, they often arrive with strong gusts and dangerous crosswinds, causing property damage and rapid, sometimes problematic, snow melt even in mid-winter. A famous example occurred in Loma on January 14–15, 1972, when a Chinook caused a staggering 103°F temperature rise in just 24 hours, the largest such change in U.S. history.
Flooding and Drought Risks
Extreme precipitation events, especially during the spring thaw when snowpack is melting, can trigger severe flooding. The 1964 flood was one of the most devastating in state history. A cool spring delayed snowmelt, followed by heavy rains (over 10 inches in 36 hours in some areas) falling on an above-average snowpack. This led to catastrophic flash floods, resulting in at least 28 deaths and millions in damages.
More recently, 2011 saw significant flooding driven by heavy spring rains combined with an exceptionally heavy snowpack. May 2011 was the second-wettest May on record, with many rivers reaching record levels. Below-normal temperatures created ice jams in some streams, further obstructing flow and exacerbating flooding. By mid-June, numerous counties and tribal reservations were declared disaster areas, with total damages exceeding $50 million. Rapid spring warming can also cause ice jam flooding.
As a state heavily reliant on agriculture, Montana is acutely vulnerable to drought. While the Dust Bowl of the 1930s remains the most infamous, recent severe droughts have also caused significant impacts. The period of July–September 2012 was the driest on record since 1895, leading to severe drought conditions across the southern half of the state by October. This drought created prime conditions for wildfires, resulting in over 2,000 fires burning more than 1.2 million acres. Warmer temperatures are increasing the risk of ‘flash droughts,’ events like the severe summer drought experienced in 2017, which develop rapidly.
Future Projections for Montana Usa Climate
Looking ahead, projections suggest continued significant changes in the Montana Usa Climate. Under a higher greenhouse gas emissions pathway, warming historically unprecedented is projected throughout this century (Figure 1). Even with lower emissions, annual average temperatures are likely to surpass historical record levels by mid-century, though the range of potential outcomes is wide. While increases in heat wave intensity are projected, the intensity of cold waves is expected to decrease.
One of the most significant projected impacts is the rising snow line, the average lowest elevation at which snow falls. This means precipitation is more likely to fall as rain instead of snow at lower mountain elevations, which are currently marginal for reliable snowpack accumulation. Higher spring temperatures are also projected to cause the snowpack to melt earlier in the year. Both factors will significantly reduce water storage in the snowpack, leading to decreased water availability, particularly during the crucial dry summer months when water demand is highest for agriculture, ecosystems, and other uses.
Although projections for overall annual precipitation are uncertain, there is a projected increase in winter and spring precipitation (Figure 6). However, the shift in snowmelt timing due to rising temperatures means runoff will occur earlier in the year. Increased heavy spring precipitation could heighten the risk of flooding. The impact on agriculture is mixed; while it could improve soil moisture, it might also delay planting and potentially reduce yields. Changes in snowmelt patterns will also affect other water-dependent industries, such as mining, recreation (like skiing and rafting), and tourism.
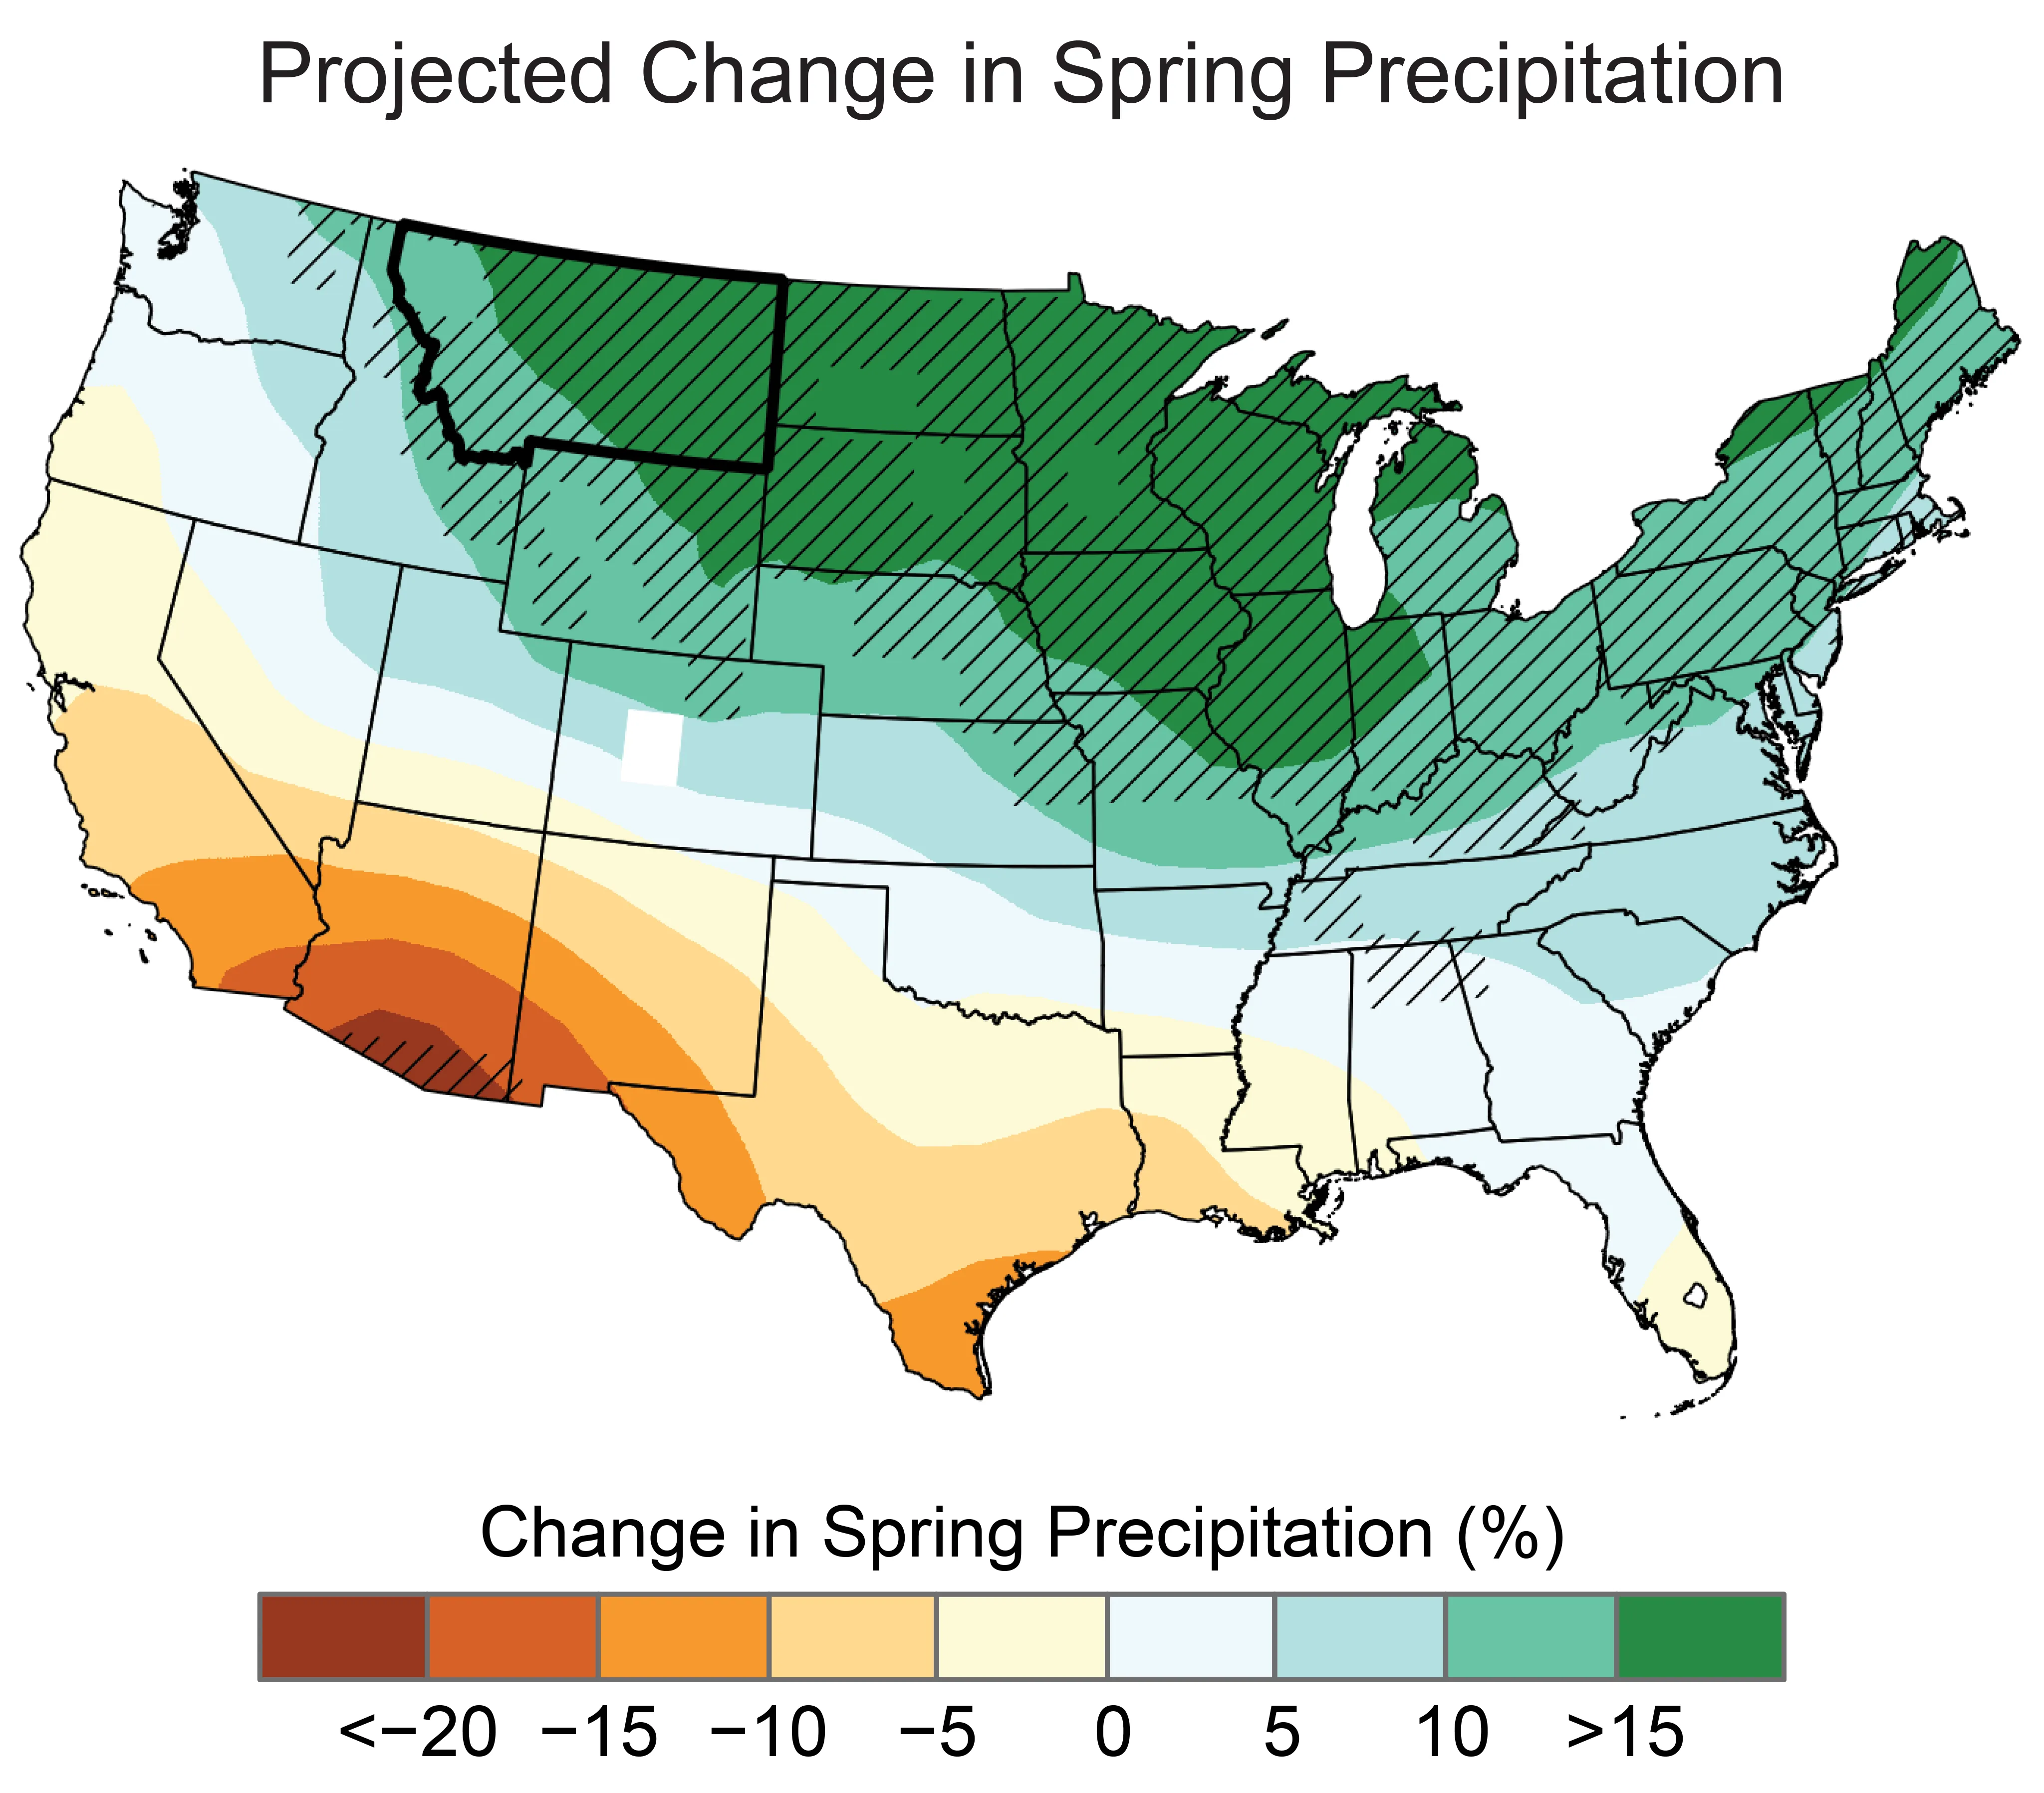 Projected change in spring precipitation for Montana Usa ClimateFigure 6: Projected changes in total spring (March–May) precipitation (%) for the middle of the 21st century compared to the late 20th century under a higher emissions pathway.
Despite potential increases in overall precipitation, the intensity of future droughts is projected to increase. This is because rising temperatures will increase the rate at which soil moisture evaporates during dry spells. Furthermore, while fall, winter, and spring precipitation might increase, a majority of climate models project decreases in summer precipitation. This combination suggests that summer droughts are likely to become more intense and potentially more frequent, leading to an increased risk and severity of wildfires across the state.
Seasonal Overview of Montana Usa Climate
To better understand the typical weather throughout the year in Montana, let’s look at the seasons:
- Spring: Highly variable and often unpredictable. It’s a transition from cold, snowy winters to warmer, sometimes wet, conditions. Snowmelt begins, feeding rivers, and rain can occur, sometimes leading to flooding. Temperatures can fluctuate wildly, with late-season snowstorms not uncommon, especially in the mountains.
- Summer: Generally warm to hot, particularly in the eastern plains. Dry air can lead to large diurnal temperature swings (warm days, cool nights). Thunderstorms are frequent, bringing rain, lightning, and sometimes hail. This is the driest period in the western mountains after the snowmelt runoff, but the wettest for the state overall due to plains thunderstorms.
- Fall: Another transition season, often bringing pleasant, crisp weather with clear skies and beautiful fall foliage, especially in the mountains. Temperatures gradually cool, and the risk of early snow increases towards the end of the season, particularly at higher elevations.
- Winter: Characterized by cold temperatures and significant snowfall, especially in the western mountains. The plains can experience bitter cold snaps, influenced by arctic air masses. Mountain regions receive abundant snow, crucial for snowpack development. Chinook winds can cause dramatic, temporary warming events along the eastern slopes.
Frequently Asked Questions About Montana Usa Climate
Q: What are the warmest and coldest temperatures ever recorded in Montana?
A: The record low is -70°F (-57°C) at Rogers Pass (1954), the lowest in the contiguous U.S. The record high is 117°F (47°C) at Medicine Lake and Glendive (1937, 1893).
Q: Does it snow everywhere in Montana?
A: Yes, most of Montana receives snowfall, but the amount varies greatly. Mountainous areas in the west receive hundreds of inches annually, while lower elevations and the eastern plains receive significantly less, though still experience snow cover during winter.
Q: Why does Montana’s climate vary so much?
A: The variation is primarily due to its large size, diverse topography (flat plains vs. high mountains), and position relative to major weather patterns and air masses from the Pacific and Arctic regions.
Q: How is climate change affecting Montana?
A: Montana is experiencing higher average temperatures, a decrease in very cold days, increases in hot days and warm nights, changes in precipitation patterns (especially shifts in snow vs. rain), earlier snowmelt, increased drought intensity, and a higher risk of wildfires.
Q: Are Chinook winds dangerous?
A: While they bring rapid warming, Chinook winds can be dangerous due to strong, gusty winds that can cause damage and hazardous driving conditions. The rapid melting of snow can also contribute to localized flooding.
In conclusion, the Montana Usa Climate is a fascinating blend of continental and mountain influences, marked by significant seasonal contrasts and notable extreme weather events. Understanding the historical trends and future projections, particularly concerning rising temperatures, changing precipitation, and impacts on the crucial mountain snowpack, is key to appreciating the dynamic environment of the Treasure State.
